การแสดงผลความสัมพันธ์เชิงเส้น

Introduction to Linear Modeling in Python

Jason Vestuto

Data Scientist

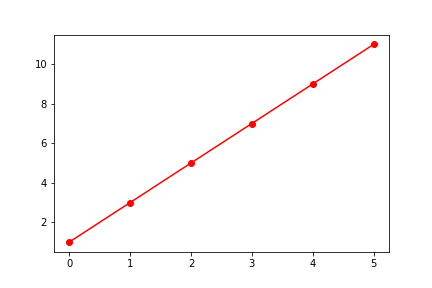
การพล็อตอย่างรวดเร็ว

import matplotlib.pyplot as plt
plt.plot(x, y, 'r-o')
plt.show()
Introduction to Linear Modeling in Python

อินเทอร์เฟซแบบออบเจกต์

# Import the pyplot module
import matplotlib.pyplot as plt
# Create figure and axis objects
fig, axis = plt.subplots()
# Prepare initial style options
options = dict(marker='o', color='blue')
Introduction to Linear Modeling in Python

อินเทอร์เฟซแบบออบเจกต์

# Call the plot method on the axis object
line = axis.plot(x, y, **options)
# Modify the axis object with set methods
_ = axis.set_ylabel('Times')
_ = axis.set_xlabel('Distances')
# Display figure
plt.show()
Introduction to Linear Modeling in Python

การแสดงผลข้อมูลเชิงเส้น

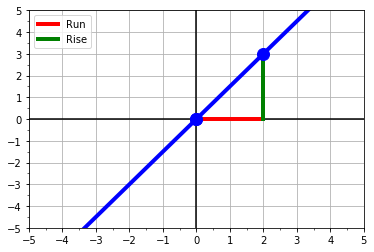
  • สองจุด:
    • (x1,y1) = (0,0)
    • (x2,y2) = (2,3)
  • การเปลี่ยนแปลงของ x และ y:
    • dy = (y2 - y1) = 3 - 0
    • dx = (x2 - x1) = 2 - 0
  • ความชัน = rise-over-run
    • slope = dy/dx = 3/2
  • จุดตัดแกน:
    • เมื่อ x=0: y1 = 0

กราฟแสดง rise over run เพื่ออธิบายความชัน

Introduction to Linear Modeling in Python

มาฝึกกันเถอะ!

Introduction to Linear Modeling in Python

Preparing Video For Download...