การแสดงผลและการพยากรณ์ด้วยโมเดล Weibull

Survival Analysis ด้วย Python

Shae Wang

Senior Data Scientist

.plot()

แสดงกราฟของค่าสัมประสิทธิ์และช่วงจาก confidence interval 95%

aft.plot()
plt.show()

ตัวอย่างกราฟ:
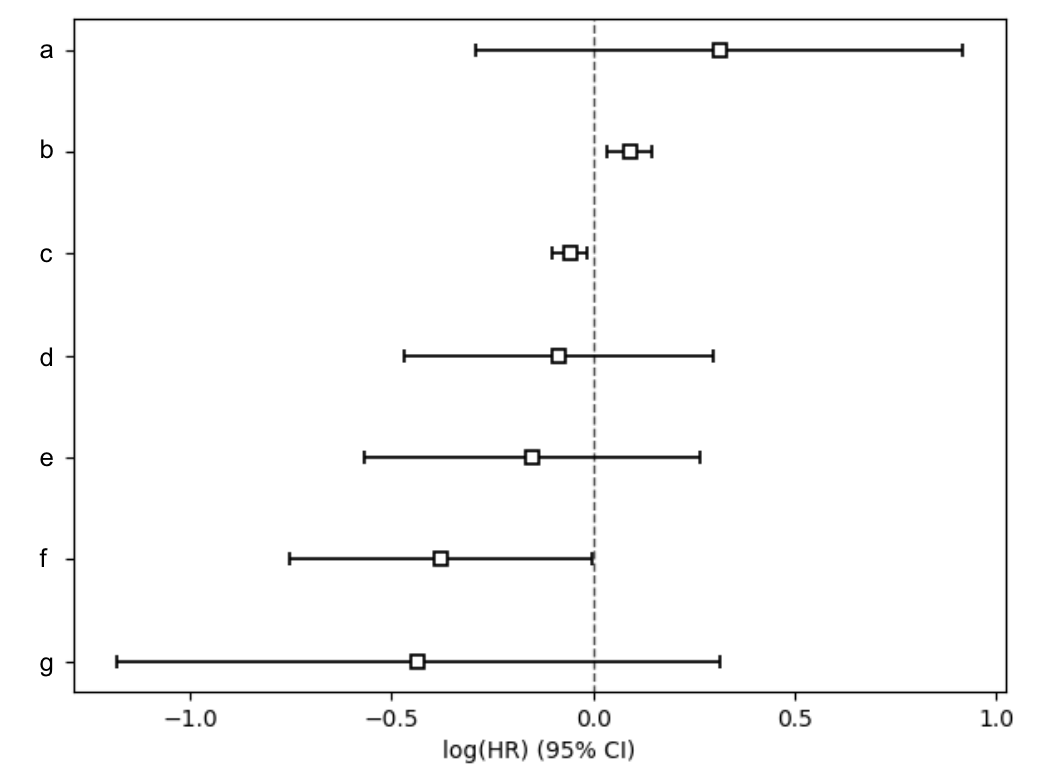
sample_covariate_plot

Survival Analysis ด้วย Python

.plot_partial_effects_on_outcome()

แสดงกราฟเปรียบเทียบ survival curve พื้นฐานกับผลลัพธ์เมื่อค่า covariate เปลี่ยนแปลง

aft.plot_partial_effects_on_outcome(covariates, values)
plt.show()
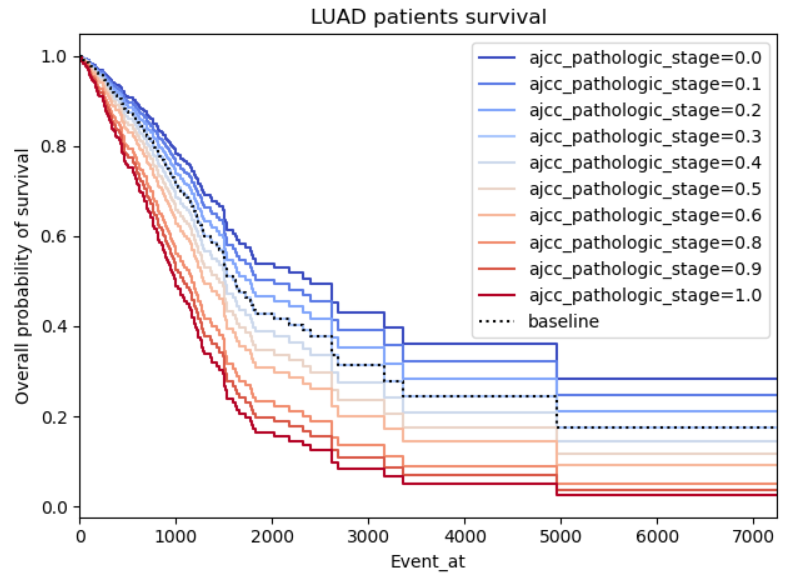
sample_partial_effects_plot

Survival Analysis ด้วย Python

วิธีพล็อต partial effects?

.plot_partial_effects_on_outcome()

  • covariates (string หรือ list): covariate ในชุดข้อมูลต้นฉบับที่ต้องการให้เปลี่ยนแปลง
  • values (iterable 1 หรือ 2 มิติ): ค่าที่ต้องการให้ covariate รับ

  • Baseline survival curve: survival curve ที่พยากรณ์จากค่าเฉลี่ยทั้งหมดในชุดข้อมูลต้นฉบับ

aft.plot_partial_effects_on_outcome(
  covariates='var', 
  values=[0, 3, 6, 9, 12, 15]
)
plt.show()
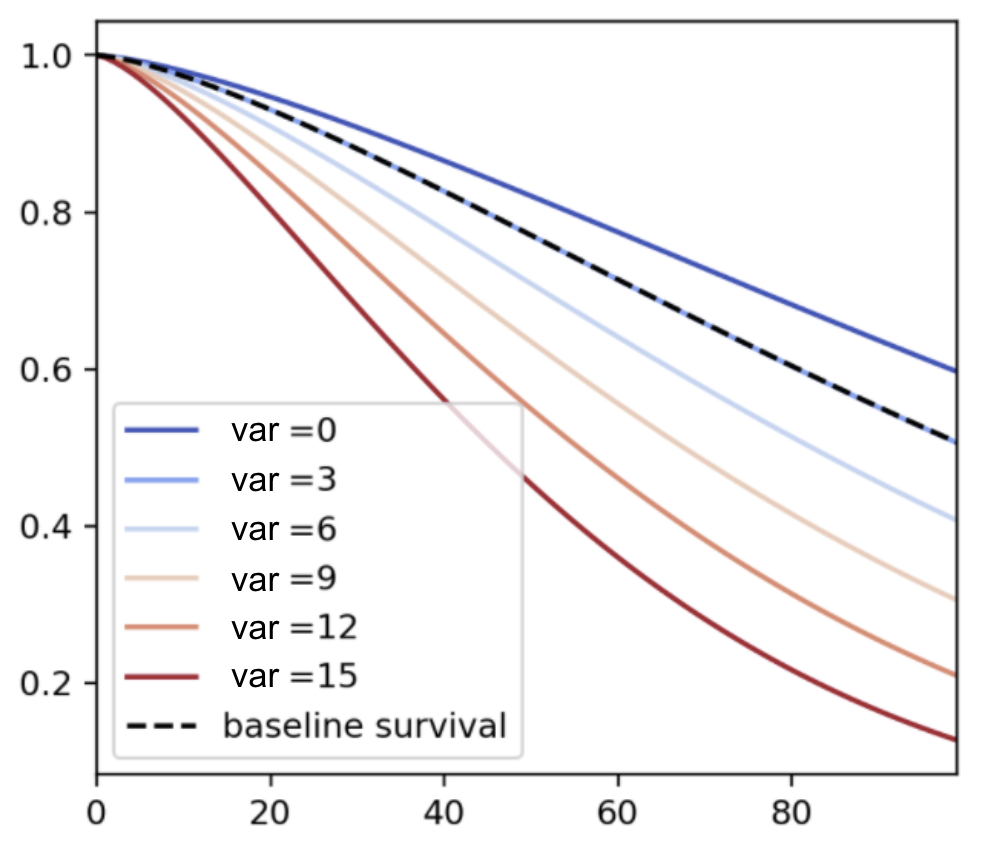
partial effects plot for weibull model

Survival Analysis ด้วย Python

วิธีพล็อต partial effects?

  • กำหนดค่าตรงๆ:
    aft.plot_partial_effects_on_outcome(
      covariates='a', 
      values=[0, 3, 6]
    )
    
  • ใช้ฟังก์ชัน range:
    aft.plot_partial_effects_on_outcome(
      covariates='a', 
      values=np.arange(10)
    )
    
  • หลาย covariate:
    aft.plot_partial_effects_on_outcome(
      covariates=['a','b'], 
      values=[[1,2],[1,3],[2,3]]
    )
    
  • สูตรกำหนดเอง:
    • การแปลงที่จำเป็น (interaction, one-hot encoding ฯลฯ) จะดำเนินการภายในโดยอัตโนมัติ
Survival Analysis ด้วย Python

ตัวอย่างสินเชื่อที่อยู่อาศัย

ตัวอย่าง DataFrame: mortgage_df

id house principal interest property_tax credit score duration paid_off
1 1 1275 0.035 0.019 780 25 0
2 0 756 0.028 0.020 695 17 1
3 0 968 0.029 0.017 810 5 0
... ... ... ... ... ... ... ...
1000 1 1505 0.041 0.023 750 30 1
Survival Analysis ด้วย Python

ตัวอย่างสินเชื่อที่อยู่อาศัย

aft.plot_partial_effects_on_outcome(
    covariates='credit score',
    values=np.arange(700, 860, 30)
)
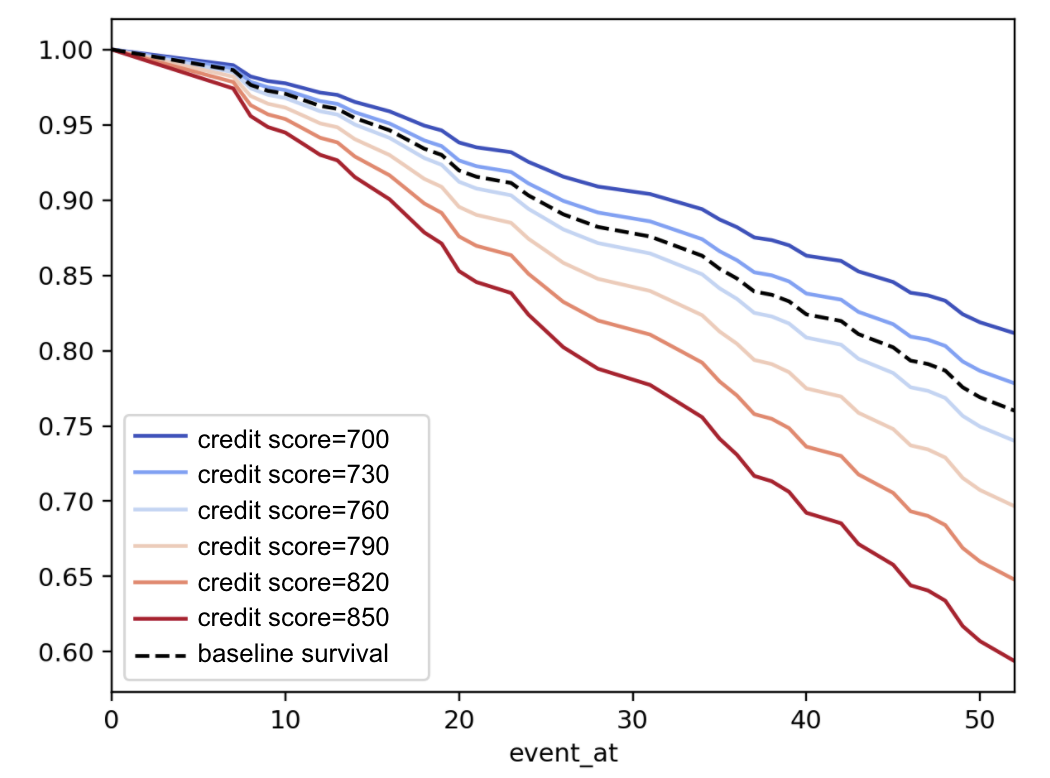
plt.show()

partial effects plot for mortgage_df

Survival Analysis ด้วย Python

พยากรณ์ survival function

  • survival curve แตกต่างกันตามค่า covariate ของแต่ละบุคคล prediction flowchart
Survival Analysis ด้วย Python

พยากรณ์ survival function

พยากรณ์ survival function ของแต่ละบุคคลตามค่า covariate

.predict_survival_function()

อาร์กิวเมนต์:

  • X (array np หรือ DataFrame): covariate ถ้าเป็น DataFrame สามารถเรียงคอลัมน์ในลำดับใดก็ได้

พยากรณ์ระยะเวลาการอยู่รอดมัธยฐานของแต่ละบุคคลตามค่า covariate

.predict_median()

อาร์กิวเมนต์:

  • df (array np หรือ DataFrame): covariate ถ้าเป็น DataFrame สามารถเรียงคอลัมน์ในลำดับใดก็ได้
Survival Analysis ด้วย Python

การพยากรณ์แบบมีเงื่อนไขตามระยะเวลาปัจจุบัน

พยากรณ์ survival function หรือระยะเวลาการอยู่รอดมัธยฐานแบบมีเงื่อนไขหลังจากระยะเวลาปัจจุบัน

  • .predict_survival_function(X, conditional_after)
  • .predict_median(df, conditional_after)

ตัวอย่าง:

aft.predict_median(new_subject)
4.0
aft.predict_median(new_subject, conditional_after=[2])
2.0
Survival Analysis ด้วย Python

มาฝึกกันเถอะ!

Survival Analysis ด้วย Python

Preparing Video For Download...