การหยุดตรวจสำหรับการละเมิดใช้เวลานานแค่ไหน?

การวิเคราะห์กิจกรรมตำรวจด้วย pandas

Kevin Markham

Founder, Data School

การวิเคราะห์คอลัมน์ประเภท object

apple
date_and_time         price    volume  change      
2018-01-08 16:00:00  174.35  20567800    down
...                     ...       ...     ...
2018-03-09 16:00:00  179.98  32185200      up
  • สร้างคอลัมน์ Boolean: True ถ้าราคาเพิ่มขึ้น และ False ในกรณีอื่น
  • คำนวณความถี่ที่ราคาเพิ่มขึ้นโดยใช้ค่าเฉลี่ยของคอลัมน์
apple.change.dtype
dtype('O')
  • ไม่สามารถใช้ .astype() ในกรณีนี้ได้
การวิเคราะห์กิจกรรมตำรวจด้วย pandas

การแมปค่าหนึ่งไปยังอีกค่าหนึ่ง

  • Dictionary ใช้แมปค่าที่มีอยู่ไปยังค่าที่ต้องการ
mapping = {'up':True, 'down':False}

apple['is_up'] = apple.change.map(mapping)
apple
date_and_time         price    volume change  is_up
2018-01-08 16:00:00  174.35  20567800   down  False
...                     ...       ...    ...    ...
2018-03-09 16:00:00  179.98  32185200     up   True
apple.is_up.mean()
0.5
การวิเคราะห์กิจกรรมตำรวจด้วย pandas

การคำนวณอัตราการตรวจค้น

  • แสดงภาพว่าการตรวจค้นเกิดขึ้นบ่อยแค่ไหนในแต่ละประเภทการละเมิด
ri.groupby('violation').search_conducted.mean()
violation
Equipment              0.064280
Moving violation       0.057014
Other                  0.045362
Registration/plates    0.093438
Seat belt              0.031513
Speeding               0.021560
search_rate = ri.groupby('violation').search_conducted.mean()
การวิเคราะห์กิจกรรมตำรวจด้วย pandas

การสร้างกราฟแท่ง

search_rate.plot(kind='bar')
plt.show()
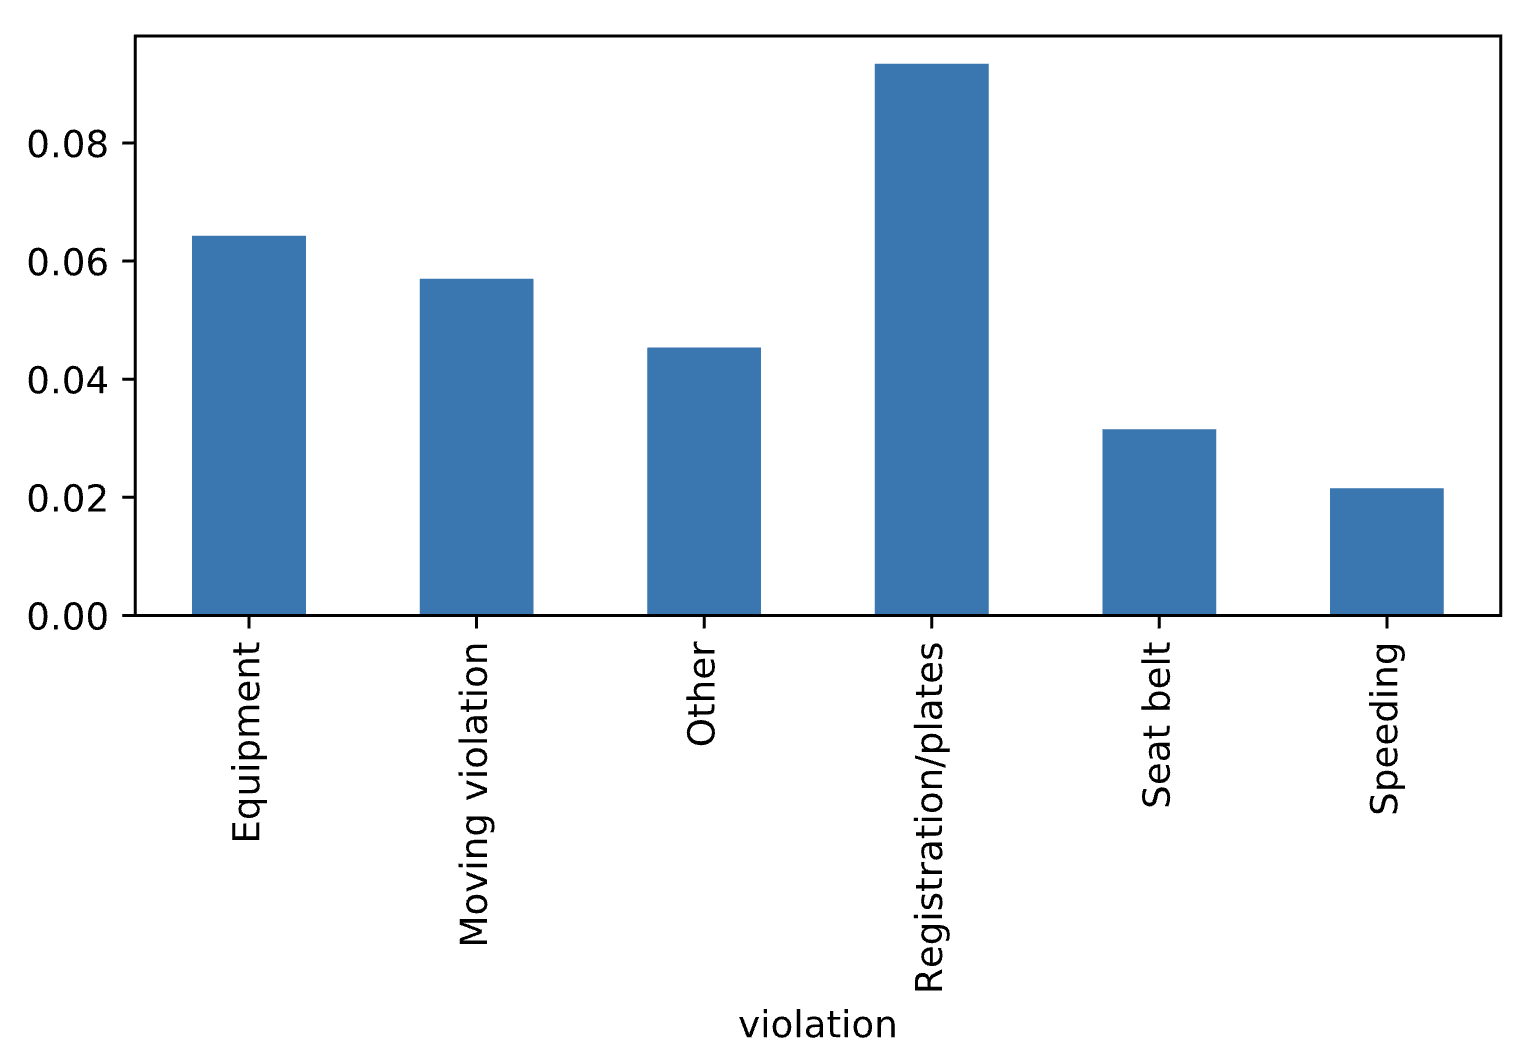
กราฟแท่งแสดงอัตราการตรวจค้นตามประเภทการละเมิด

การวิเคราะห์กิจกรรมตำรวจด้วย pandas

การเรียงลำดับแท่ง (1)

  • เรียงลำดับแท่งจากซ้ายไปขวาตามขนาด
search_rate.sort_values()
violation
Speeding               0.021560
Seat belt              0.031513
Other                  0.045362
Moving violation       0.057014
Equipment              0.064280
Registration/plates    0.093438
Name: search_conducted, dtype: float64
การวิเคราะห์กิจกรรมตำรวจด้วย pandas

การเรียงลำดับแท่ง (2)

search_rate.sort_values().plot(kind='bar')
plt.show()
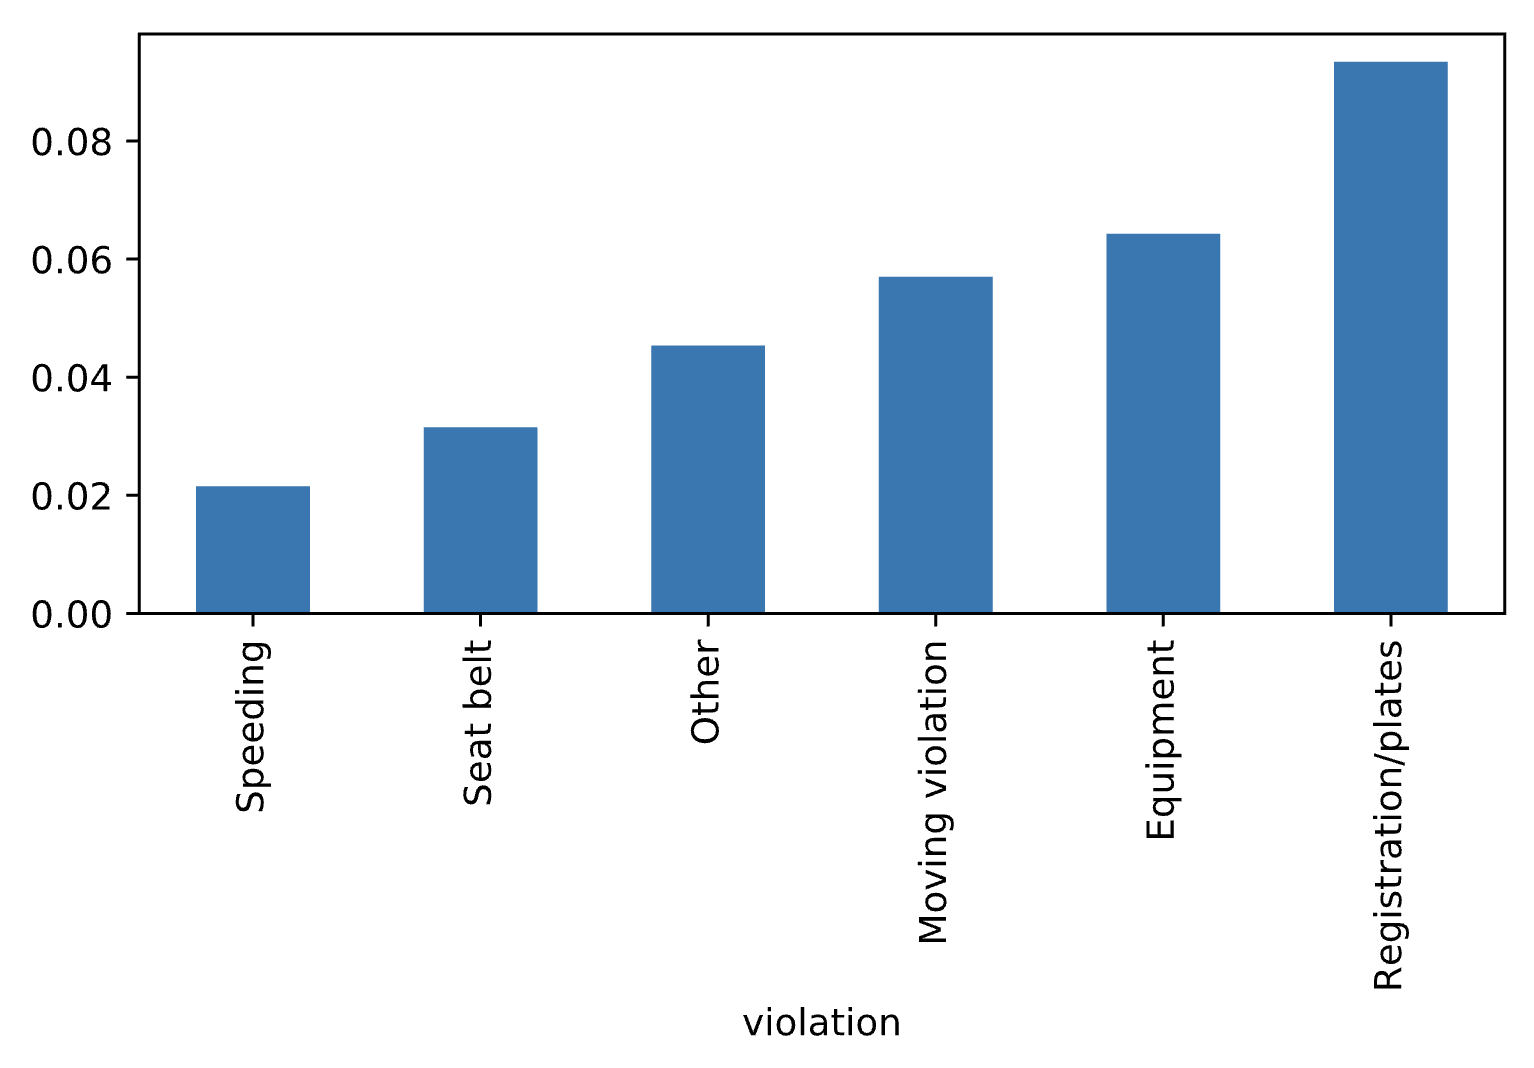
กราฟแท่งเรียงลำดับแสดงอัตราการตรวจค้นตามประเภทการละเมิด

การวิเคราะห์กิจกรรมตำรวจด้วย pandas

การหมุนแท่ง

search_rate.sort_values().plot(kind='barh')
plt.show()
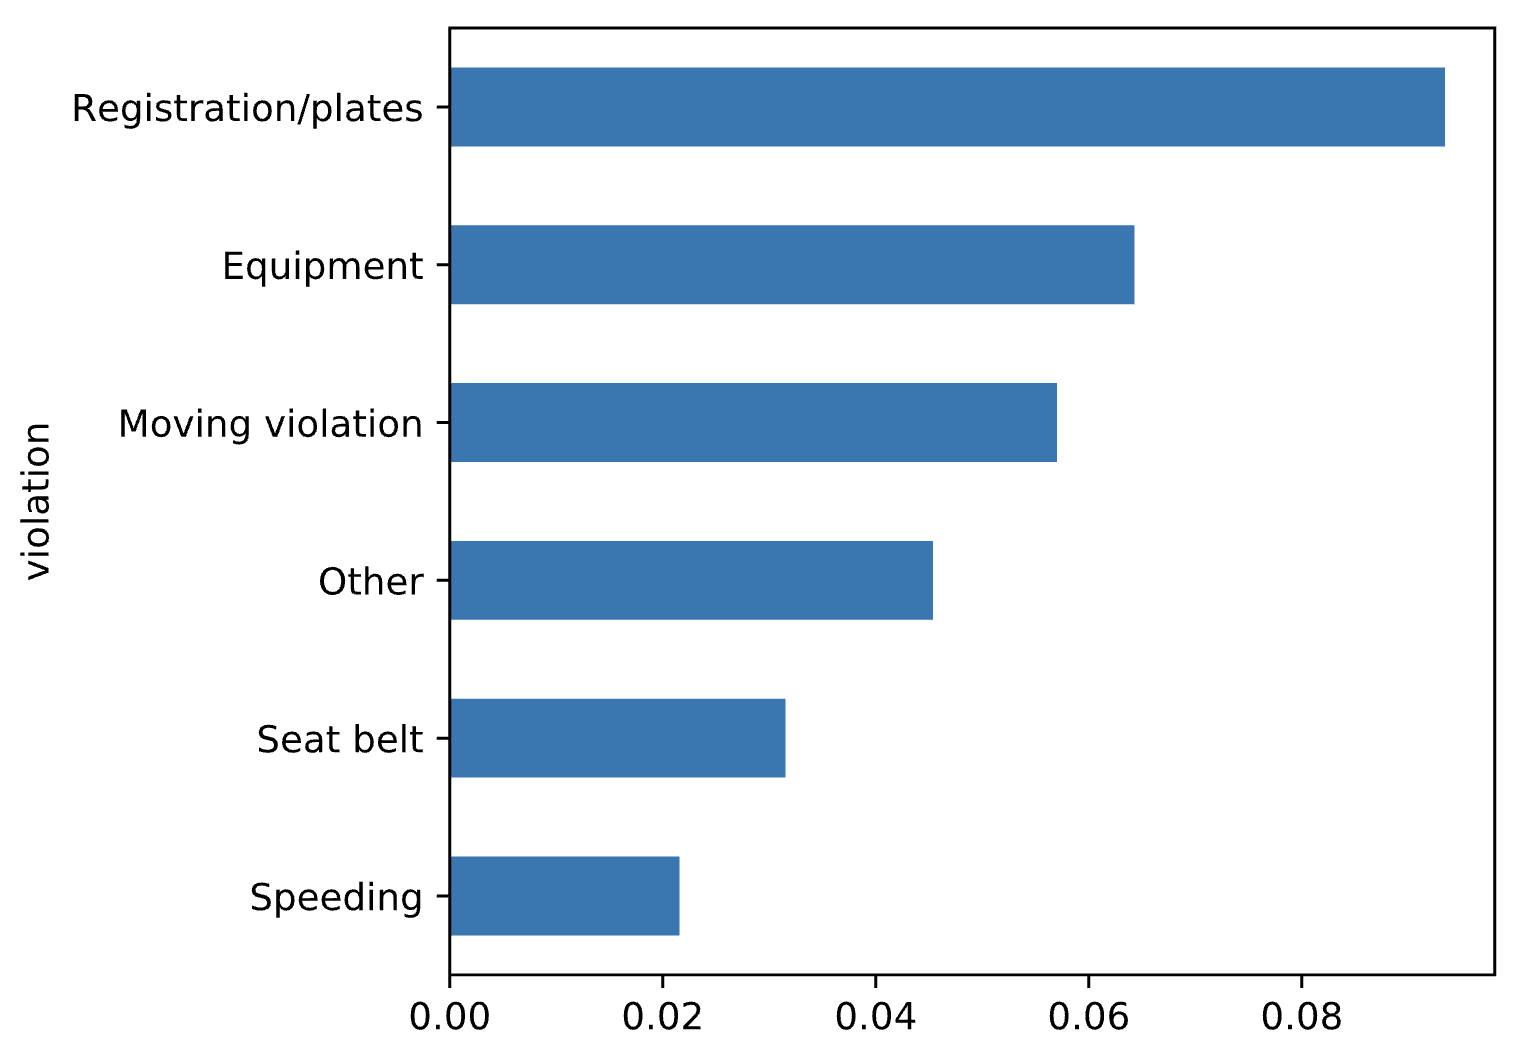
กราฟแท่งแนวนอนแสดงอัตราการตรวจค้นตามประเภทการละเมิด

การวิเคราะห์กิจกรรมตำรวจด้วย pandas

มาฝึกกันเถอะ!

การวิเคราะห์กิจกรรมตำรวจด้วย pandas

Preparing Video For Download...