ยินดีต้อนรับสู่คอร์ส!
การวิเคราะห์พอร์ตโฟลิโอระดับกลางใน R

Ross Bennett
Instructor
สิ่งที่จะได้เรียนรู้
ต่อยอดจากแนวคิดพื้นฐานใน "Introduction to Portfolio Analysis in R"
สำรวจแนวคิดขั้นสูงในกระบวนการปรับพอร์ตโฟลิโอให้เหมาะที่สุด
ใช้แพ็กเกจ R
PortfolioAnalyticsเพื่อแก้ปัญหาการปรับพอร์ตโฟลิโอที่สะท้อนสถานการณ์จริง
Modern Portfolio Theory
Modern Portfolio Theory (MPT) เสนอโดย Harry Markowitz ในปี 1952
MPT ระบุว่าเป้าหมายของนักลงทุนคือการเพิ่มผลตอบแทนที่คาดหวังของพอร์ตโฟลิโอให้สูงสุดภายใต้ระดับความเสี่ยงที่กำหนด
วัตถุประสงค์ทั่วไป:
เพิ่มอัตราส่วนผลตอบแทนต่อความเสี่ยงให้สูงสุด
ลดความเสี่ยงให้ต่ำสุด
ตัวอย่าง Mean - Standard Deviation: การตั้งค่า
library(PortfolioAnalytics)
data(edhec)
data <- edhec[,1:8]
# Create the portfolio specification
port_spec <- portfolio.spec(colnames(data))
port_spec <- add.constraint(portfolio = port_spec, type = "full_investment")
port_spec <- add.constraint(portfolio = port_spec, type = "long_only")
port_spec <- add.objective(portfolio = port_spec, type = "return", name = "mean")
port_spec <- add.objective(portfolio = port_spec, type = "risk", name = "StdDev")
**************************************************
PortfolioAnalytics Portfolio Specification
**************************************************
Call:
portfolio.spec(assets = colnames(data))

Number of assets: 8
Asset Names
[1] "Convertible Arbitrage"  "CTA Global"             "Distressed Securities"
[4] "Emerging Markets"       "Equity Market Neutral"  "Event Driven"
[7] "Fixed Income Arbitrage" "Global Macro"

Constraints
Enabled constraint types
        - full_investment
        - long_only

Objectives:
Enabled objective names
        - mean
        - StdDev
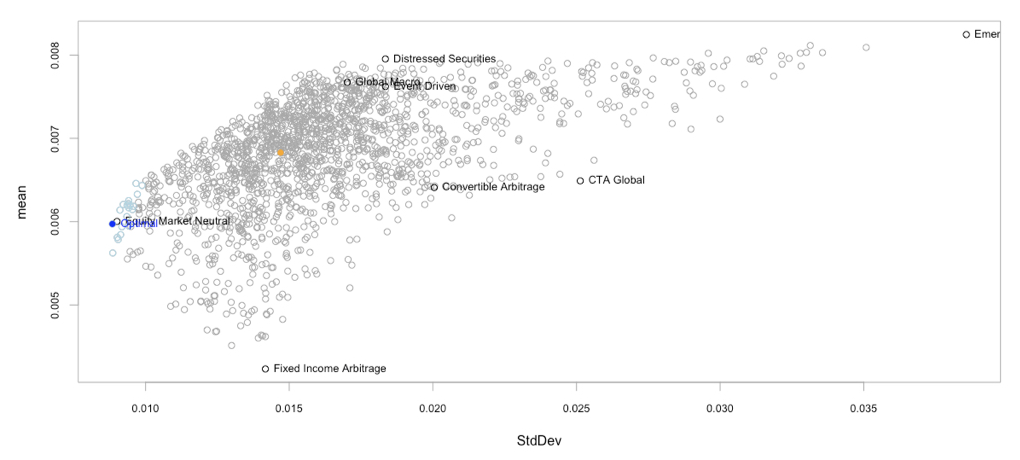
ตัวอย่าง Mean - Standard Deviation: การปรับให้เหมาะที่สุด
# Run optimization and chart results in risk-reward space
opt <- optimize.portfolio(data,
                   portfolio = port_spec,
                   optimize_method = "random",
                   trace = TRUE)
chart.RiskReward(opt,
                 risk.col = "StdDev",
                 return.col = "mean",
                 chart.assets = TRUE)
ตัวอย่าง Mean - Standard Deviation: การปรับให้เหมาะที่สุด
มาฝึกกันเถอะ!
การวิเคราะห์พอร์ตโฟลิโอระดับกลางใน R

