การแสดงผลอัตราส่วนสำหรับการวิเคราะห์ภายในบริษัท

การวิเคราะห์งบการเงินด้วย Python

Rohan Chatterjee

Risk modeler

การแสดงผลอัตราส่วนทางการเงิน

  • Bar plot มีประโยชน์สำหรับ
    • การแสดงผลอัตราส่วนทางการเงินเฉลี่ยของบริษัท และ
    • การประเมินผลการดำเนินงานเทียบกับค่าเฉลี่ยอุตสาหกรรม
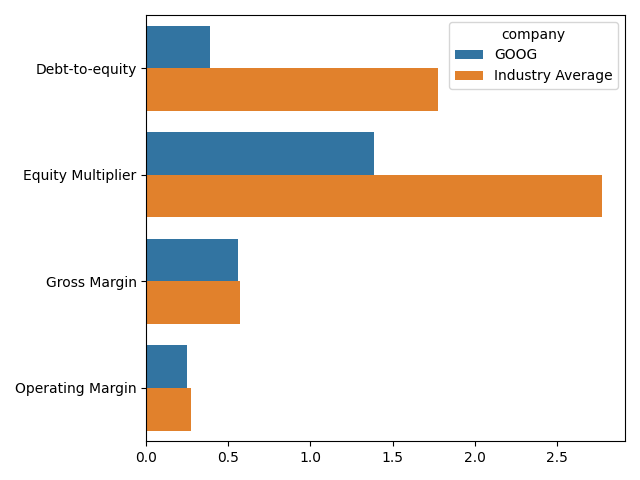
ภาพ bar plot แสดงการเปรียบเทียบอัตราส่วนทางการเงินของ Google กับค่าเฉลี่ยของอัตราส่วนเหล่านั้นในอุตสาหกรรมเทคโนโลยี

การวิเคราะห์งบการเงินด้วย Python

การเตรียมข้อมูลสำหรับการพล็อต

  • ใช้ pivot_table เพื่อคำนวณค่าเฉลี่ยของอัตราส่วนรายบริษัท:
    avg_company_ratio = plot_dat.pivot_table(index=["comp_type",
                                                    "company"],
                          values=["Gross Margin", "Operating Margin",
                                  "Debt-to-equity", "Equity Multiplier"],
                                            aggfunc="mean").reset_index()
    
  • print(avg_company_ratio.head())

ภาพแสดง 5 แถวแรกของ DataFrame avg_company_ratio โดยคอลัมน์ที่น่าสนใจคือ gross margin และ operating margin ซึ่งแสดงค่าเฉลี่ยของอัตราส่วนเหล่านั้นสำหรับบริษัทต่างๆ

การวิเคราะห์งบการเงินด้วย Python

การเตรียมข้อมูลสำหรับการพล็อต

  • ใช้ pivot_table เพื่อคำนวณค่าเฉลี่ยของอัตราส่วนรายอุตสาหกรรม:
    avg_industry_ratio = plot_dat.pivot_table(index="comp_type",
                          values=["Gross Margin", "Operating Margin",
                                  "Debt-to-equity", 
                                  "Equity Multiplier"],
                                            aggfunc="mean").reset_index()
    
  • print(avg_industry_ratio.head())

ภาพแสดง 5 แถวแรกของ DataFrame avg_industry_ratio โดยคอลัมน์ที่น่าสนใจคือ gross margin และ operating margin ซึ่งแสดงค่าเฉลี่ยของอัตราส่วนเหล่านั้นสำหรับอุตสาหกรรมต่างๆ

การวิเคราะห์งบการเงินด้วย Python

การเตรียมข้อมูลสำหรับการพล็อต

  • การพล็อตข้อมูลใน seaborn ต้องการข้อมูลในรูปแบบ "long" ใช้ pd.melt เพื่อแปลง DataFrame avg_industry_ratio และ avg_company_ratio ให้อยู่ในรูปแบบ long:
    molten_plot_company = pd.melt(avg_company_ratio, id_vars=["comp_type",
                                                              "company"])
    molten_plot_industry = pd.melt(avg_industry_ratio,
                                   id_vars=["comp_type"])
    
การวิเคราะห์งบการเงินด้วย Python
  • print(molten_plot_company.head())

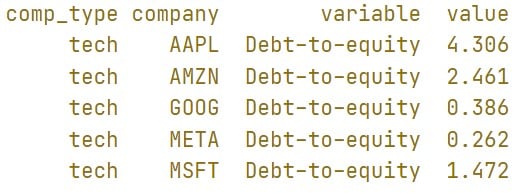
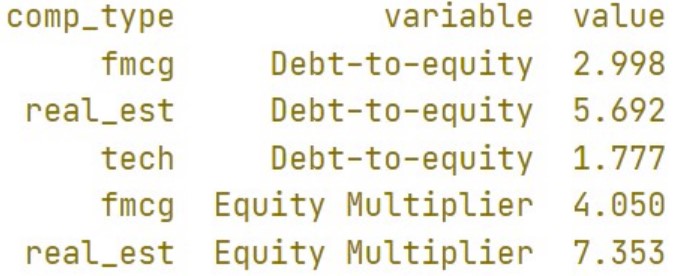
ภาพแสดง 5 แถวแรกของ DataFrame molten_plot_industry สิ่งสำคัญคือ DataFrame อยู่ในรูปแบบ long ของ average_industry_ratio โดยคอลัมน์ variable ระบุชื่ออัตราส่วน และคอลัมน์ value ให้ค่าของอัตราส่วนนั้น

  • print(molten_plot_industry.head())

ภาพแสดง 5 แถวแรกของ DataFrame molten_plot_industry สิ่งสำคัญคือ DataFrame อยู่ในรูปแบบ long ของ average_company_ratio โดยคอลัมน์ variable ระบุชื่ออัตราส่วน และคอลัมน์ value ให้ค่าของอัตราส่วนนั้น

การวิเคราะห์งบการเงินด้วย Python

การเตรียมข้อมูลสำหรับการพล็อต

  • Seaborn ต้องการข้อมูลทั้งหมดที่จะพล็อตใน DataFrame เดียว
  • ใช้ pd.concat เพื่อรวม molten_plot_company และ molten_plot_industry เข้าด้วยกัน
  • molten_plot_industry ไม่มีคอลัมน์ company เนื่องจากมีเพียงค่าเฉลี่ยของอัตราส่วนรายอุตสาหกรรมโดยรวม
  • pd.concat ต้องการให้ทั้งสอง DataFrame มีคอลัมน์เหมือนกัน จึงต้องเพิ่มคอลัมน์ company ให้ molten_plot_industry
molten_plot_industry["company"] = "Industry Average"
molten_plot = pd.concat([molten_plot_company, molten_plot_industry])
การวิเคราะห์งบการเงินด้วย Python

สร้าง bar graph

sns.barplot(data=molten_plot, y="variable", x="value", hue="company", ci=None)
plt.xlabel(""), plt.ylabel("")
plt.show()

ภาพเดียวกับสไลด์ที่ 2 ของวิดีโอนี้ แสดง bar plot เปรียบเทียบอัตราส่วนทางการเงินของ Google กับค่าเฉลี่ยของอัตราส่วนเหล่านั้นในอุตสาหกรรมเทคโนโลยี

การวิเคราะห์งบการเงินด้วย Python

มาฝึกกันเถอะ!

การวิเคราะห์งบการเงินด้วย Python

Preparing Video For Download...