บทนำสู่ plotly

การสร้างกราฟิกแบบโต้ตอบด้วย plotly ใน R

Adam Loy

Statistician, Carleton College

plotly

  • ไลบรารีสำหรับสร้างกราฟิกแบบโต้ตอบและไดนามิกบนเว็บ
  • กราฟทำงานได้หลายรูปแบบ
    • หน้าต่างแสดงผล
    • เอกสาร R Markdown
    • แอป shiny
  • พัฒนาอย่างต่อเนื่องและมีชุมชนที่เข้มแข็ง
การสร้างกราฟิกแบบโต้ตอบด้วย plotly ใน R

กราฟิกแบบ Static vs. Interactive

การสร้างกราฟิกแบบโต้ตอบด้วย plotly ใน R

ข้อมูล wine

library(dplyr)
glimpse(wine)
Rows: 178
Columns: 14
$ Type            <fct> 1, 1, 1, 1, 1, 1, 1, 1, 1, 1, 1, 1, 1, 1, 1, 1...
$ Alcohol         <dbl> 14.23, 13.20, 13.16, 14.37, 13.24, 14.20, 14.3...
$ Malic           <dbl> 1.71, 1.78, 2.36, 1.95, 2.59, 1.76, 1.87, 2.15...
...
$ Hue             <dbl> 1.04, 1.05, 1.03, 0.86, 1.04, 1.05, 1.02, 1.06...
$ Dilution        <dbl> 3.92, 3.40, 3.17, 3.45, 2.93, 2.85, 3.58, 3.58...
$ Proline         <int> 1065, 1050, 1185, 1480, 735, 1450, 1290, 1295,...
การสร้างกราฟิกแบบโต้ตอบด้วย plotly ใน R

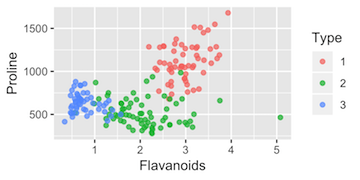
Scatterplot ด้วย ggplot2

library(ggplot2)
static <- wine %>%
  ggplot(aes(x = Flavanoids, y = Proline, color = Type)) +
  geom_point()
  • ชุดข้อมูล wine
  • Aesthetics, aes()
  • เพิ่ม layer, geom_point()
การสร้างกราฟิกแบบโต้ตอบด้วย plotly ใน R

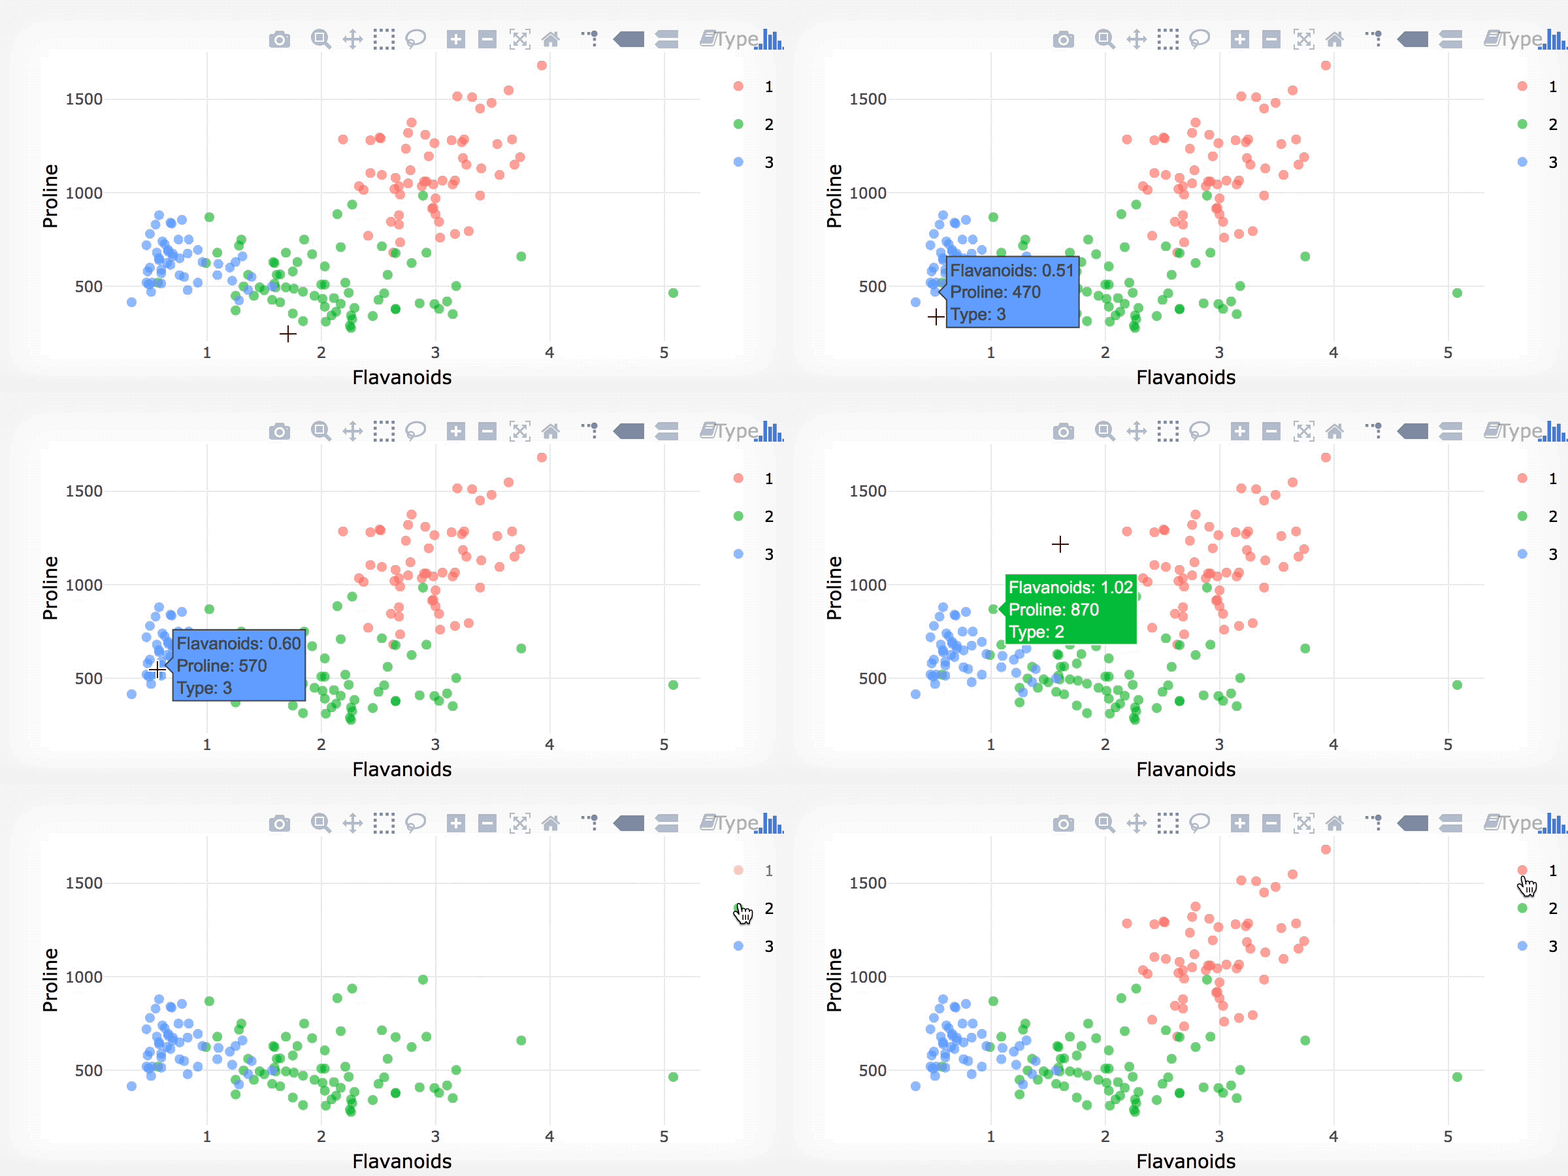
ggplotly()

library(plotly)
ggplotly(static)

การสร้างกราฟิกแบบโต้ตอบด้วย plotly ใน R

ข้อสังเกต

  • Interactive ≠ ดีเสมอไป

    • การออกแบบที่ไม่ดี = กราฟ interactive ที่แย่
    • ควรทำตามหลักการออกแบบ data visualization
  • ggplotly() เป็นเพียงจุดเริ่มต้น

การสร้างกราฟิกแบบโต้ตอบด้วย plotly ใน R

มาฝึกกันเถอะ!

การสร้างกราฟิกแบบโต้ตอบด้วย plotly ใน R

Preparing Video For Download...