Principal components ในการวิเคราะห์ถดถอย
Machine Learning for Marketing Analytics ใน R

Verena Pflieger
Data Scientist at INWT Statistics
PC ในการวิเคราะห์ถดถอย I
mod1 <- lm(customerSatis ~ ., dataCustomers)library(car) vif(mod1)
      nOrders       nItemsOrdered          nItemsSold        salesOrdered
    29.482287           24.437448           10.390998            5.134720
    salesSold         returnRatio       shareOwnBrand           shareSale
     9.685617           23.778800            1.571607            1.178773
 shareVoucher          crDuration monetaryReturnRatio  meanDaysBetwOrders
     1.213011            1.757509           10.632243            1.698369
salesPerOrder        salesPerItem       itemsPerOrder   itemsSoldPerOrder
     6.563474            4.557981            4.821610           15.949072
# Create dataframe with customer satisfaction and first 6 components
dataCustComponents <- cbind(dataCustomers[, "customerSatis"],
                            pcaCust$x[,1:6]) %>%
  as.data.frame
mod2 <- lm(customerSatis ~ ., dataCustComponents)
vif(mod2)
PC1 PC2 PC3 PC4 PC5 PC6
  1   1   1   1   1   1
summary(mod1)$adj.r.squared
0.8678583
summary(mod2)$adj.r.squared
0.7123822
summary(mod2)
Call:
lm(formula = customerSatis ~ ., data = dataCustComponents)
Residuals:
    Min      1Q  Median      3Q     Max
-3.9279 -0.2411  0.0179  0.2865  1.4972
Coefficients:
             Estimate Std. Error t value Pr(>|t|)
(Intercept)  2.985945   0.014039 212.682  < 2e-16 ***
PC1         -0.175434   0.006704 -26.167  < 2e-16 ***
PC2          0.296659   0.007643  38.815  < 2e-16 ***
PC3         -0.012816   0.010838  -1.182    0.237
PC4         -0.116651   0.011665 -10.000  < 2e-16 ***
PC5          0.101963   0.012508   8.152 1.09e-15 ***
PC6          0.126677   0.013072   9.691  < 2e-16 ***
- - -
Signif. codes:  0 '***' 0.001 '**' 0.01 '*' 0.05 '.' 0.1 ' ' 1
Residual standard error: 0.4415 on 982 degrees of freedom
Multiple R-squared:  0.7141,    Adjusted R-squared:  0.7124
F-statistic: 408.9 on 6 and 982 DF,  p-value: < 2.2e-16
| สิ่งที่เรียนรู้เกี่ยวกับ PCA | |
|---|---|
| ได้เรียนรู้... | วิธีลดจำนวนตัวแปรโดยไม่สูญเสียข้อมูลมากเกินไป |
| ว่าควรทำ standardize ตัวแปรก่อนทำ PCA | |
| วิธีกำหนดจำนวน component ที่เหมาะสม | |
| วิธีแปลความหมายของ component ที่เลือก |
| สิ่งที่เรียนรู้จากโมเดล | |
|---|---|
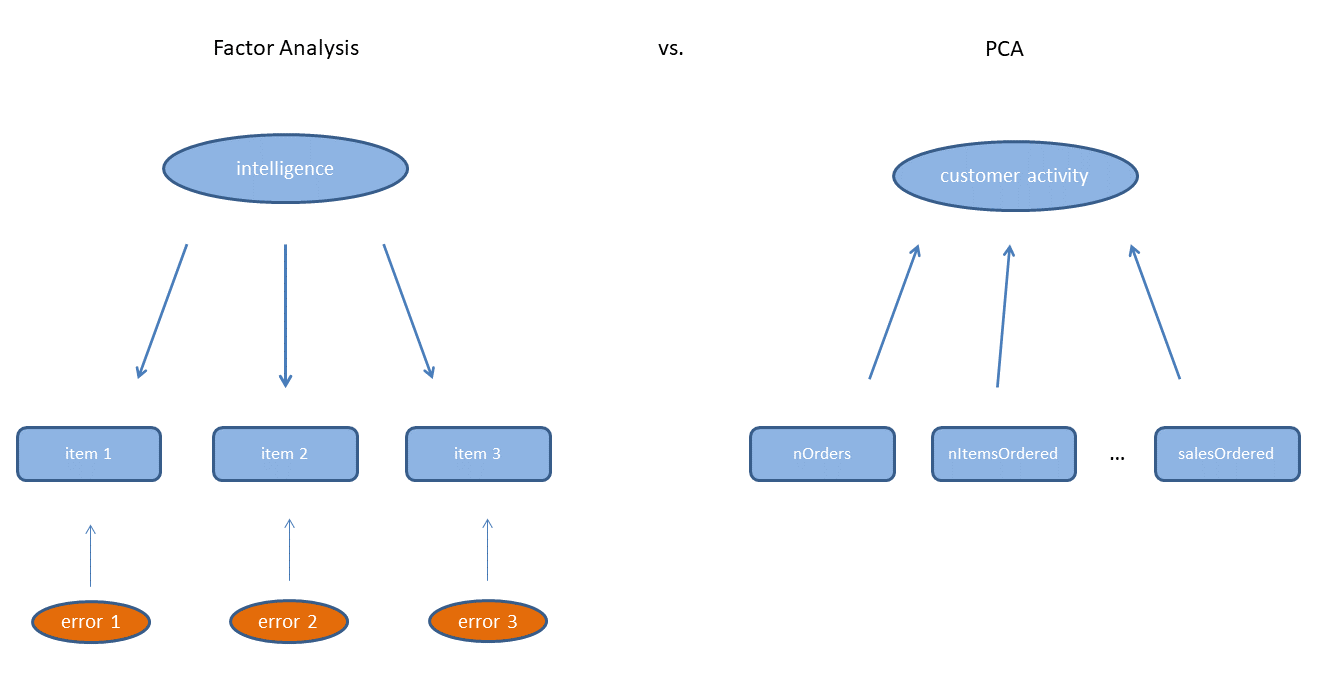
| ได้เรียนรู้... | ว่าตัวแปรเดิมสามารถลดเหลือ 6 component ได้ เช่น กิจกรรมของลูกค้า พฤติกรรมการคืนสินค้า และการรับรู้แบรนด์ |
| ว่าการใช้ 6 component แรกอธิบายความพึงพอใจของลูกค้าทำให้ explained variance ลดลง แต่แก้ปัญหา multicollinearity ได้ |
มาฝึกกันเถอะ!
Machine Learning for Marketing Analytics ใน R

