การตรวจสอบนอกกลุ่มตัวอย่างและ Cross Validation
Machine Learning for Marketing Analytics ใน R

Verena Pflieger
Data Scientist at INWT Statistics
ความพอดีนอกกลุ่มตัวอย่าง: ข้อมูลฝึกและข้อมูลทดสอบ
1) แบ่งชุดข้อมูลเป็นข้อมูลฝึกและข้อมูลทดสอบ
# Generating random index for training and test set
# set.seed ensures reproducibility of random components
set.seed(534381)

churnData$isTrain <- rbinom(nrow(churnData), 1, 0.66)
train <- subset(churnData, churnData$isTrain == 1)
test <- subset(churnData, churnData$isTrain == 0)
ความพอดีนอกกลุ่มตัวอย่าง: การสร้างโมเดล
2) สร้างโมเดลจากข้อมูลฝึก
# Modeling logitTrainNew
logitTrainNew <- glm( returnCustomer ~ title + newsletter +
                     websiteDesign + paymentMethod + couponDiscount +
                     purchaseValue + throughAffiliate +
                     shippingFees + dvd + blueray + vinyl +
                     videogameDownload + prodOthers + prodRemitted,
                     family = binomial, data = train)

# Out-of-sample prediction for logitTrainNew
test$predNew <- predict(logitTrainNew, type = "response",
                        newdata = test)
ความแม่นยำนอกกลุ่มตัวอย่าง
# Calculating the confusion matrix
confMatrixNew <- confusion.matrix(test$returnCustomer, test$predNew,
                 threshold = 0.3)
confMatrixNew

# Calculating the accuracy
accuracyNew <- sum(diag(confMatrixNew)) / sum(confMatrixNew)
accuracyNew
    obs
pred     0    1
   0 11939 2449
   1   716  350

0.7951987
Cross-validation: การตั้งค่า
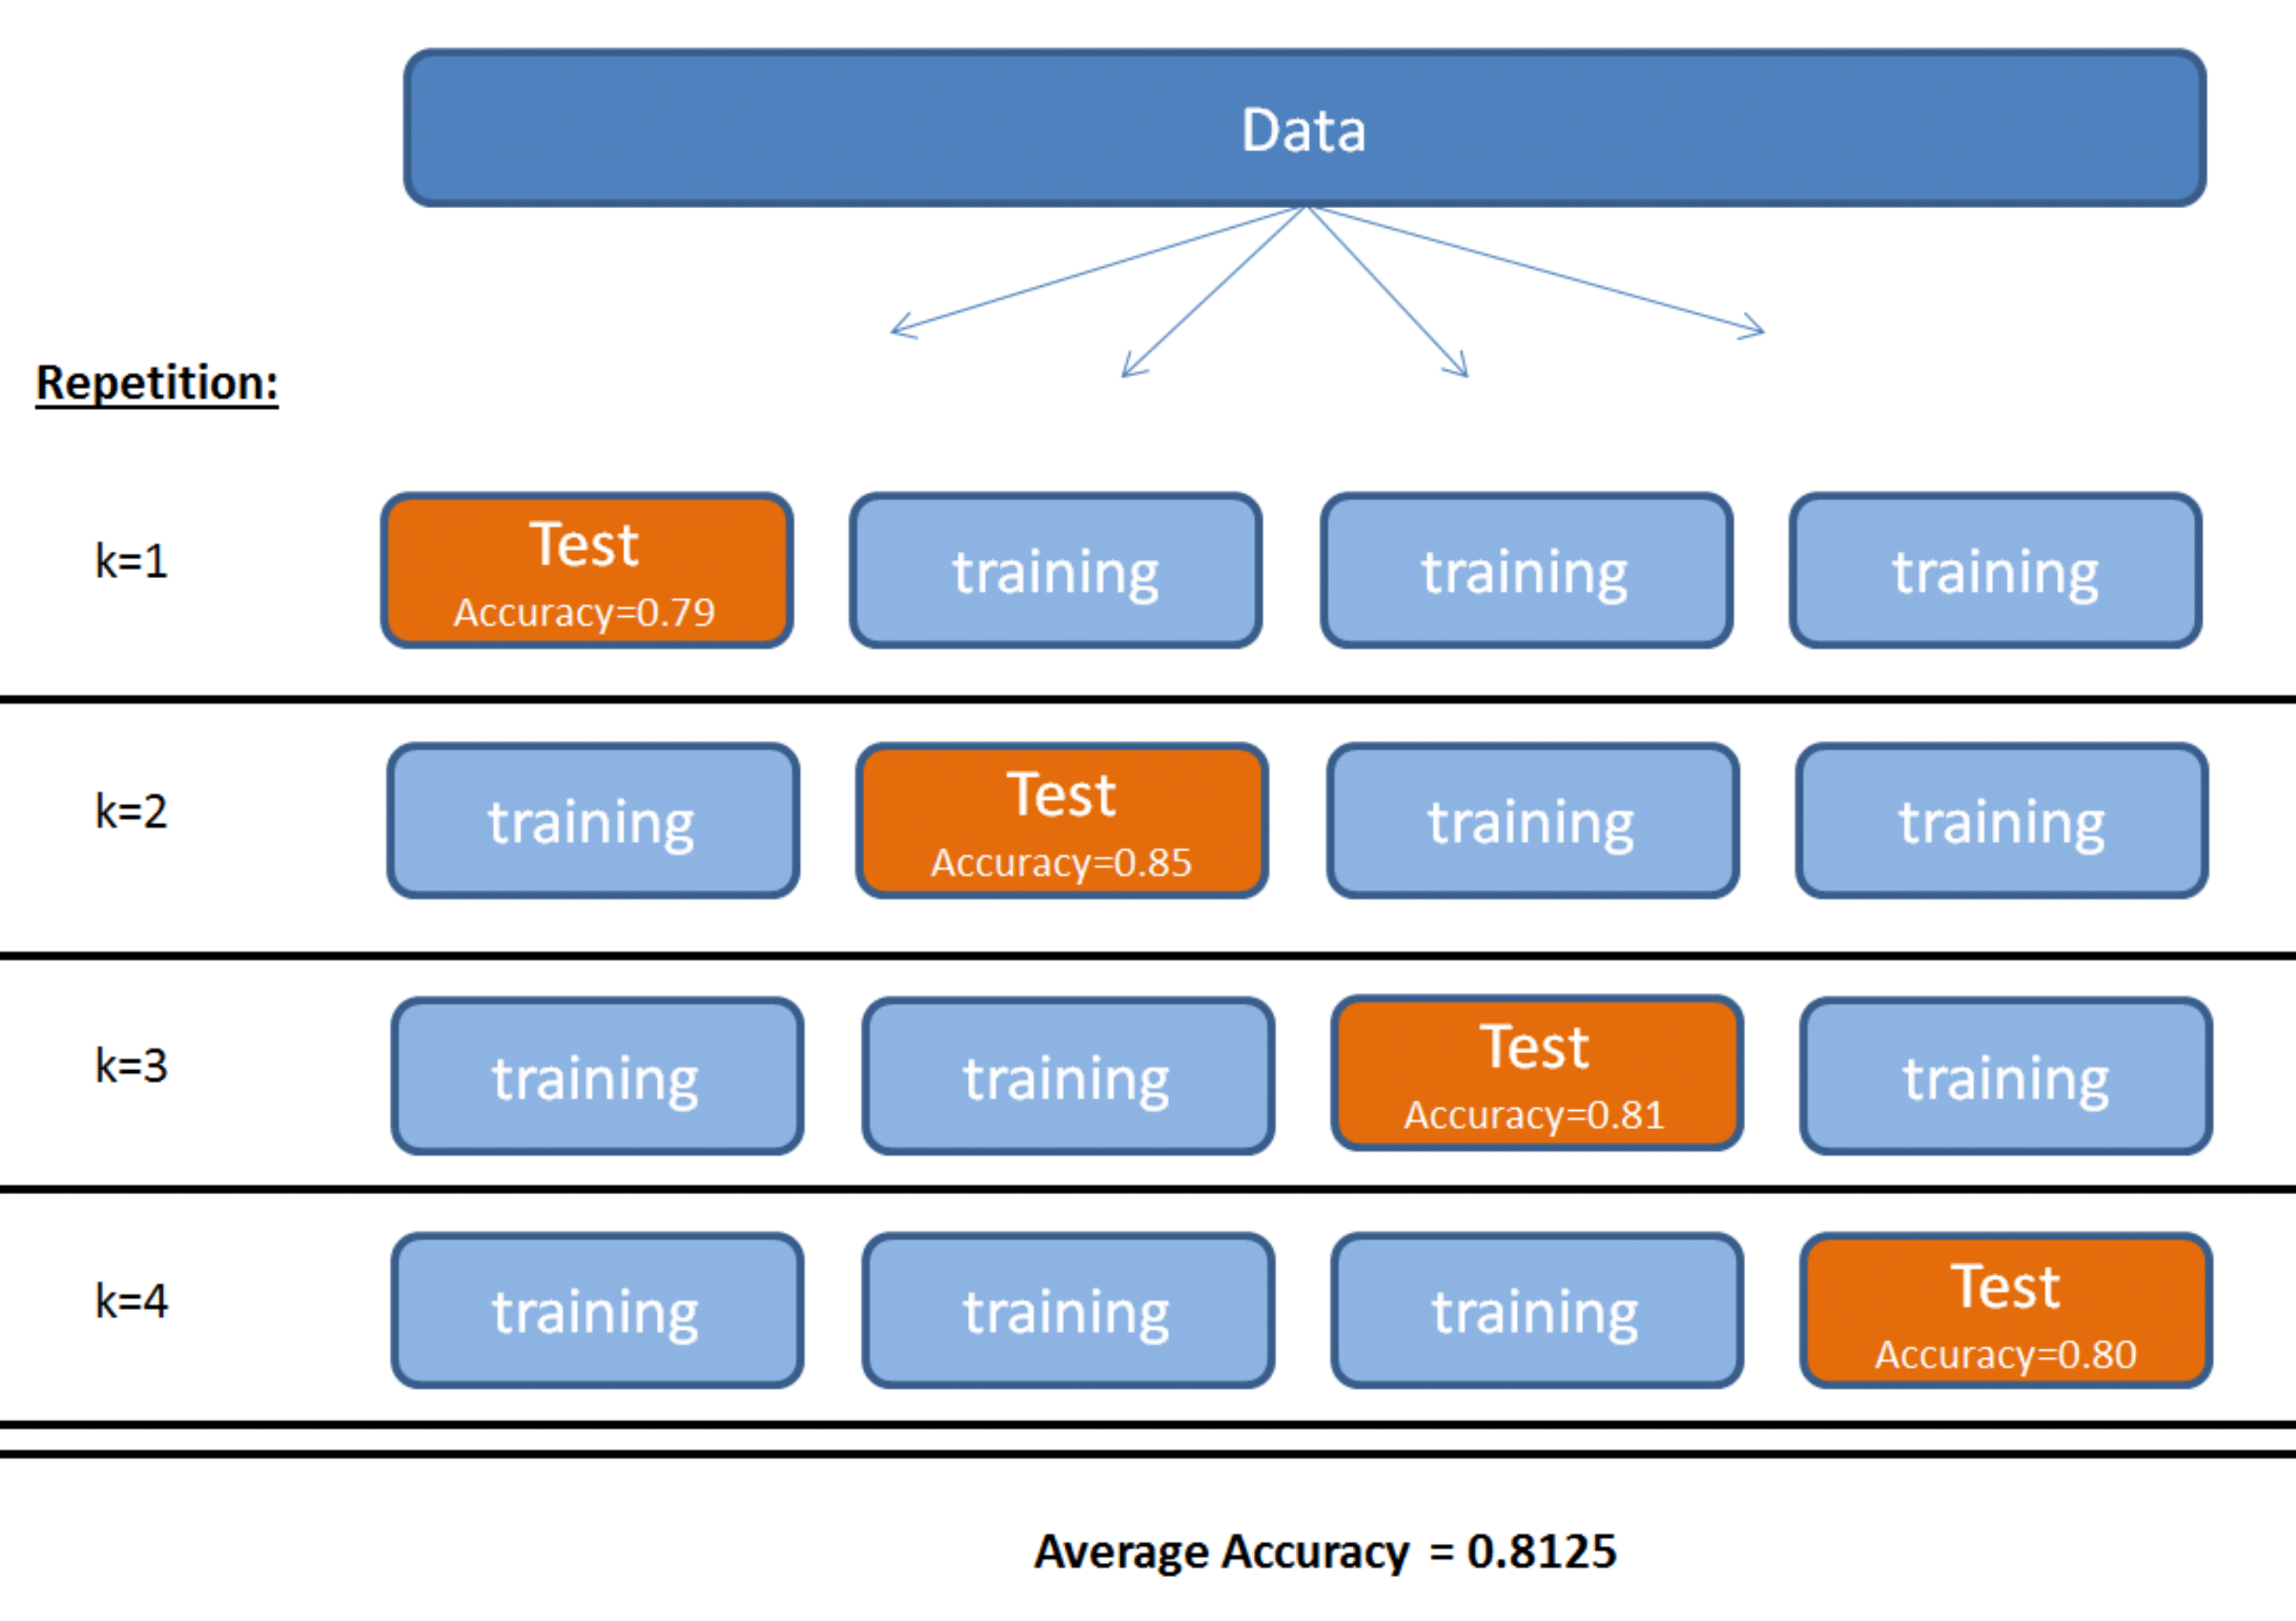
Cross-validation: ความแม่นยำ
การคำนวณความแม่นยำด้วย Cross-validation
library(boot)
# Accuracy function with threshold = 0.3
Acc03 <- function(r, pi = 0) {
  cm <- confusion.matrix(r, pi, threshold = 0.3)
  acc <- sum(diag(cm)) / sum(cm)
  return(acc)}
# Accuracy
set.seed(534381)
cv.glm(churnData, logitModelNew, cost = Acc03, K = 6)$delta
0.7943894
| สิ่งที่เรียนรู้จาก Logistic Regression | |
|---|---|
| คุณได้เรียนรู้... | วิธีคาดการณ์ลูกค้าร้านค้าออนไลน์ที่มีแนวโน้มจะเลิกใช้บริการ |
| การใช้ Binary Logistic Regression คำนวณความน่าจะเป็น | |
| ว่าการเลือกค่า threshold มีผลสำคัญต่อผลลัพธ์ |
| สิ่งที่เรียนรู้จากโมเดล | |
|---|---|
| คุณได้เรียนรู้... | ว่าลูกค้าที่สมัครรับจดหมายข่าวมีแนวโน้มกลับมาใช้บริการมากกว่า |
| ว่าลูกค้าที่ใช้คูปองมีแนวโน้มกลับมาน้อยกว่า | |
| ว่าลูกค้าที่ไม่เสียค่าจัดส่งมีแนวโน้มกลับมามากกว่า | |
| ฯลฯ |
แบบฝึกหัดสุดท้าย!
Machine Learning for Marketing Analytics ใน R

