รูปแบบการเดินทางไปทำงาน

การวิเคราะห์ข้อมูลสำมะโนประชากรสหรัฐฯ ด้วย Python

Lee Hachadoorian

Asst. Professor of Instruction, Temple University

ตารางข้อมูลการเดินทาง

ข้อมูลผู้เดินทาง

  • วิธีการเดินทาง (รถยนต์, ขนส่งสาธารณะ ฯลฯ)
  • เวลาที่ใช้ในการเดินทาง
  • เวลาออกจากบ้าน/ถึงที่ทำงาน

พื้นที่การเดินทาง

  • ที่พักอาศัย: สถานที่ที่คนอาศัยอยู่
  • สถานที่ทำงาน: ใช้ระบุประชากรแรงงานในระดับ county, tract ฯลฯ
การวิเคราะห์ข้อมูลสำมะโนประชากรสหรัฐฯ ด้วย Python

การเก็บค่าธรรมเนียมการจราจรในนิวยอร์กซิตี้
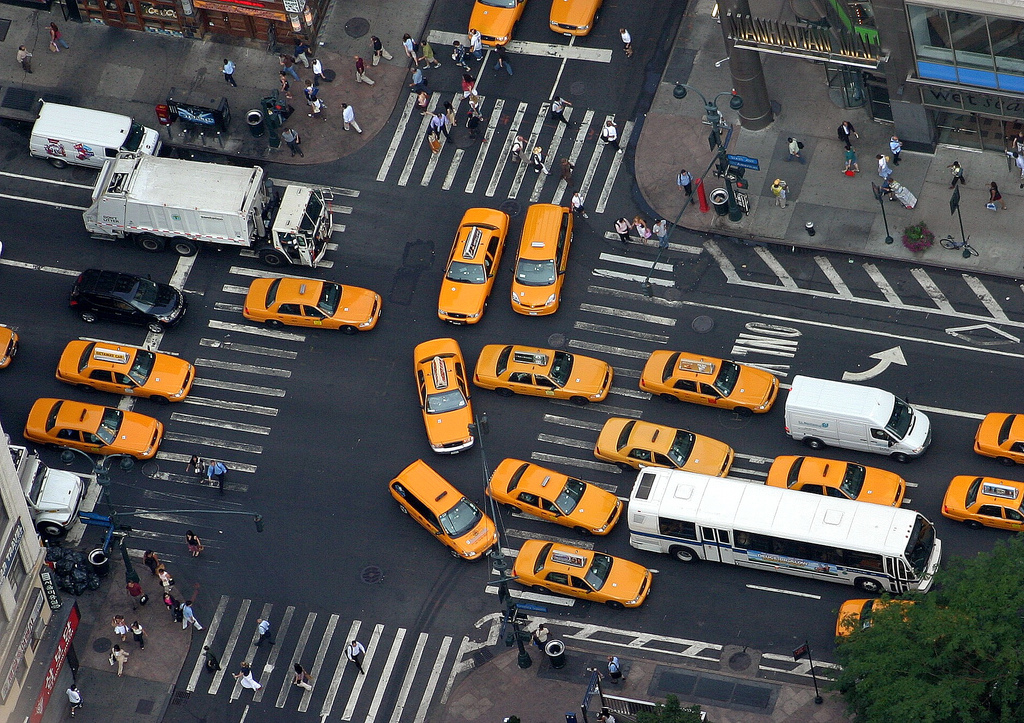
  • อยู่ระหว่างการถกเถียงในนิวยอร์ก (ต้นปี 2019)
  • ความพยายามครั้งก่อนล้มเหลว (2007)
  • กังวลเรื่องภาระค่าใช้จ่ายสำหรับครัวเรือนรายได้ปานกลางถึงต่ำ

ภาพถ่ายทางอากาศของรถยนต์และแท็กซี่บนถนนในนิวยอร์กซิตี้

1 Photo by Brian Jeffery Beggerly (CC BY 2.0)
การวิเคราะห์ข้อมูลสำมะโนประชากรสหรัฐฯ ด้วย Python

Table B08519: Means Of Transportation To Work By Workers' Earnings In The Past 12 Months (In 2017 Inflation-Adjusted Dollars) For Workplace Geography

Total
    $1 to $9,999 or loss
    $10,000 to $14,999
    $15,000 to $24,999
    $25,000 to $34,999
    $35,000 to $49,999
    $50,000 to $64,999
    $65,000 to $74,999
    $75,000 or more
Car truck or van - drove alone
    <repeat income categories>
Car truck or van - carpooled
    <repeat income categories>
Public transportation (excluding taxicab)
    <repeat income categories>
etc...
การวิเคราะห์ข้อมูลสำมะโนประชากรสหรัฐฯ ด้วย Python

การตอบสนองของ API

print(r.json())
[['B08519_011E', 'B08519_012E', 'B08519_013E', 'B08519_014E', 'B08519_015E',
  'B08519_016E', 'B08519_017E', 'B08519_018E', 'B08519_020E', 'B08519_021E', 
  ... 
  'B08519_061E', 'B08519_062E', 'B08519_063E', 'state', 'county'], 
 ['10927', '9172', '19659', '22110', '32287', 
  '32977', '15693', '106972', '3663', '2518', 
  ...
  '7457', '2664', '20684', '36', '061']]
การวิเคราะห์ข้อมูลสำมะโนประชากรสหรัฐฯ ด้วย Python

การจัดรูปแบบข้อมูล

# Read data row into list
data_row = r.json()[1][:-2]

# Break data row into list of lists iter_len = 8 data = [data_row[i:i+iter_len] for i in range(0, len(data_row), iter_len)]
print(data)
[['10927', '9172', '19659', '22110', '32287', '32977', '15693', '106972'], 
['3663', '2518', '5484', '5625', '8028', '7990', '3369', '22958'], 
['139358', '97178', '200514', '184510', '255491', '240973', '116673', '700808'], 
['16743', '9117', '15900', '13710', '17442', '20206', '10370', '85879'], ...]
การวิเคราะห์ข้อมูลสำมะโนประชากรสหรัฐฯ ด้วย Python

สร้าง DataFrame

# Define row names and column names
modes = ["drove_alone", "carpooled", "public", "walked", "taxi", 
         "worked_at_home"]

incomes = ["0k", "10k", "15k", "25k", "35k", "50k", "65k", "75k"]
# Create DataFrame manhattan = pd.DataFrame(data=data, index=modes, columns=incomes) manhattan = manhattan.astype(int)
การวิเคราะห์ข้อมูลสำมะโนประชากรสหรัฐฯ ด้วย Python

สร้าง DataFrame

print(manhattan)
                    0k    10k     15k   ...       50k     65k     75k
drove_alone      10716   8965   19294   ...     31502   15519  104078
carpooled         3740   2451    5852   ...      7994    3438   22625
public          140957  99474  197241   ...    235158  111959  654800
walked           16795   9045   15451   ...     20704   10663   83681
taxi              3201   2209    4515   ...      6551    3029   35572
worked_at_home    6854   3885    5489   ...      7776    2809   19598

[6 rows x 8 columns]
การวิเคราะห์ข้อมูลสำมะโนประชากรสหรัฐฯ ด้วย Python

สร้าง Heatmap

# Create heatmap of commuters by mode by income
sns.heatmap(manhattan, annot=manhattan // 1000, fmt="d", cmap="YlGnBu")
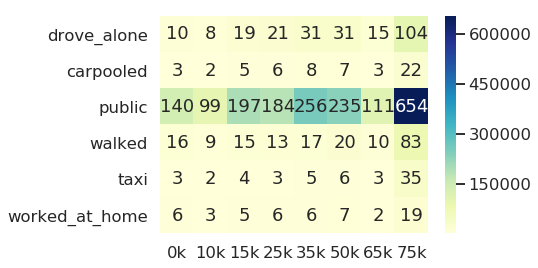
Heatmap แสดงแถวของวิธีการเดินทางและคอลัมน์ของกลุ่มรายได้ โดยระบายสีตามจำนวนผู้เดินทางในแต่ละช่อง แถวขนส่งสาธารณะมีสีเข้มกว่า และช่องขนส่งสาธารณะที่มีรายได้เกิน $75,000 มีสีเข้มที่สุด

การวิเคราะห์ข้อมูลสำมะโนประชากรสหรัฐฯ ด้วย Python

มาฝึกกันเถอะ!

การวิเคราะห์ข้อมูลสำมะโนประชากรสหรัฐฯ ด้วย Python

Preparing Video For Download...