การวิเคราะห์ข้อมูลสำมะโนประชากรสหรัฐฯ ด้วย Python
Lee Hachadoorian
Asst. Professor of Instruction, Temple University
ชื่อตาราง "B07xxx" โดยทั่วไปมีคอลัมน์ดังนี้:
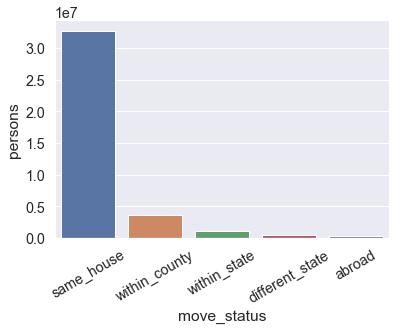
print(to_cali_2016)
move_status persons
0 same_house 32740745
1 within_county 3581323
2 within_state 1062756
3 different_state 501384
4 abroad 305148
sns.barplot(x = "move_status",
y = "persons",
data = to_cali_2016)
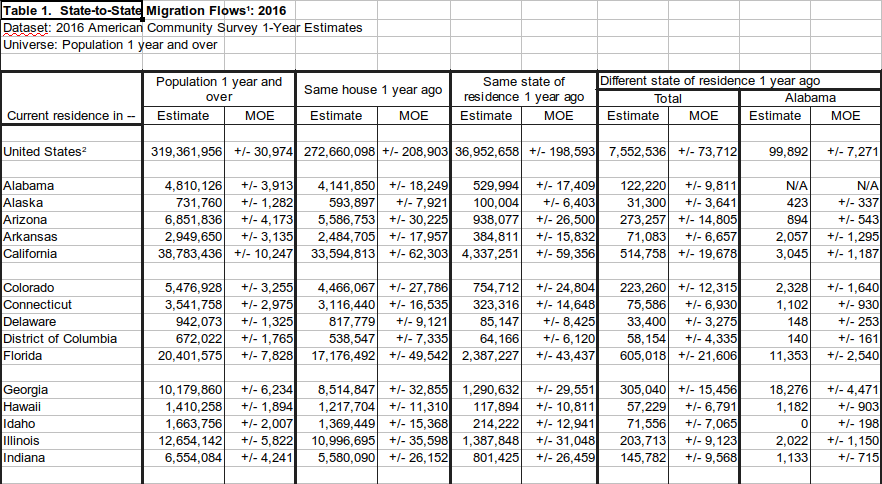
ข้อมูลจาก ACS 2016 ตาราง B07001: การเคลื่อนย้ายทางภูมิศาสตร์ในปีที่ผ่านมาตามอายุสำหรับที่อยู่ปัจจุบันในสหรัฐอเมริกา


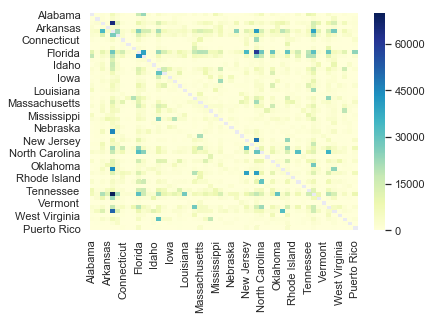
print(state_to_state.head())
Alabama Alaska Arizona ... Wisconsin Wyoming Puerto Rico
Alabama NaN 576.0 1022.0 ... 874.0 539.0 335.0
Alaska 423.0 NaN 1176.0 ... 260.0 291.0 848.0
Arizona 894.0 1946.0 NaN ... 6736.0 925.0 1462.0
Arkansas 2057.0 103.0 836.0 ... 539.0 178.0 857.0
California 3045.0 4206.0 33757.0 ... 7354.0 2674.0 1102.0
sns.heatmap(state_to_state, cmap="YlGnBu")
การวิเคราะห์ข้อมูลสำมะโนประชากรสหรัฐฯ ด้วย Python