Аналіз даних перепису США в Python
Lee Hachadoorian
Asst. Professor of Instruction, Temple University
Назви таблиць «B07xxx», зазвичай із такими стовпцями:
print(to_cali_2016)
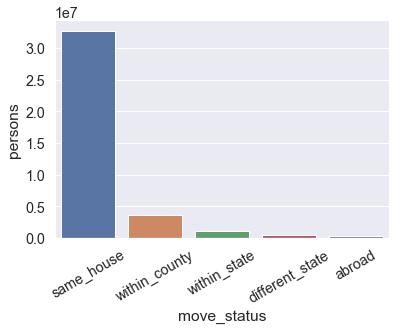
move_status persons
0 same_house 32740745
1 within_county 3581323
2 within_state 1062756
3 different_state 501384
4 abroad 305148
sns.barplot(x = "move_status",
y = "persons",
data = to_cali_2016)
Дані з ACS 2016, таблиця B07001: Geographical Mobility in the Past Year by Age for Current Residence in United States


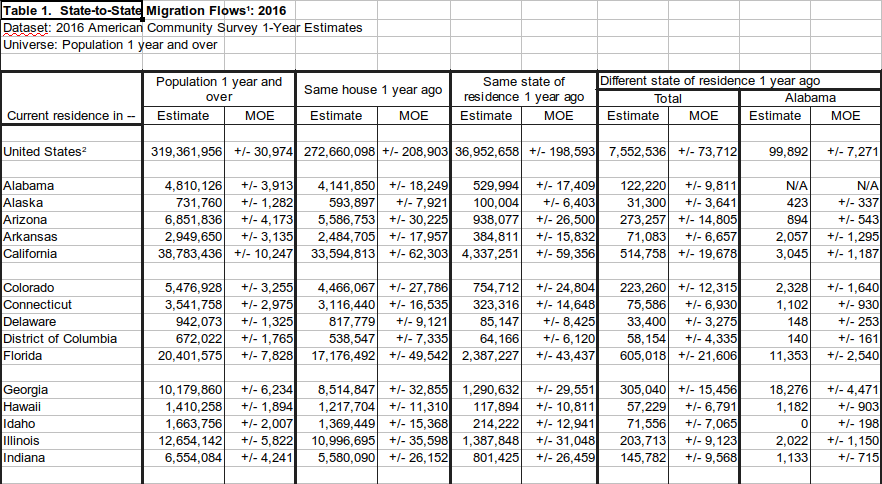
print(state_to_state.head())
Alabama Alaska Arizona ... Wisconsin Wyoming Puerto Rico
Alabama NaN 576.0 1022.0 ... 874.0 539.0 335.0
Alaska 423.0 NaN 1176.0 ... 260.0 291.0 848.0
Arizona 894.0 1946.0 NaN ... 6736.0 925.0 1462.0
Arkansas 2057.0 103.0 836.0 ... 539.0 178.0 857.0
California 3045.0 4206.0 33757.0 ... 7354.0 2674.0 1102.0
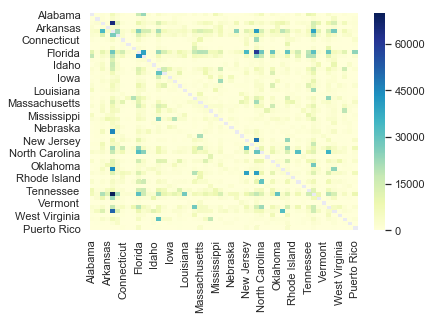
sns.heatmap(state_to_state, cmap="YlGnBu")
Аналіз даних перепису США в Python