Visualisera mätvärden

Kundkorgsanalys i R

Christopher Bruffaerts

Statistician

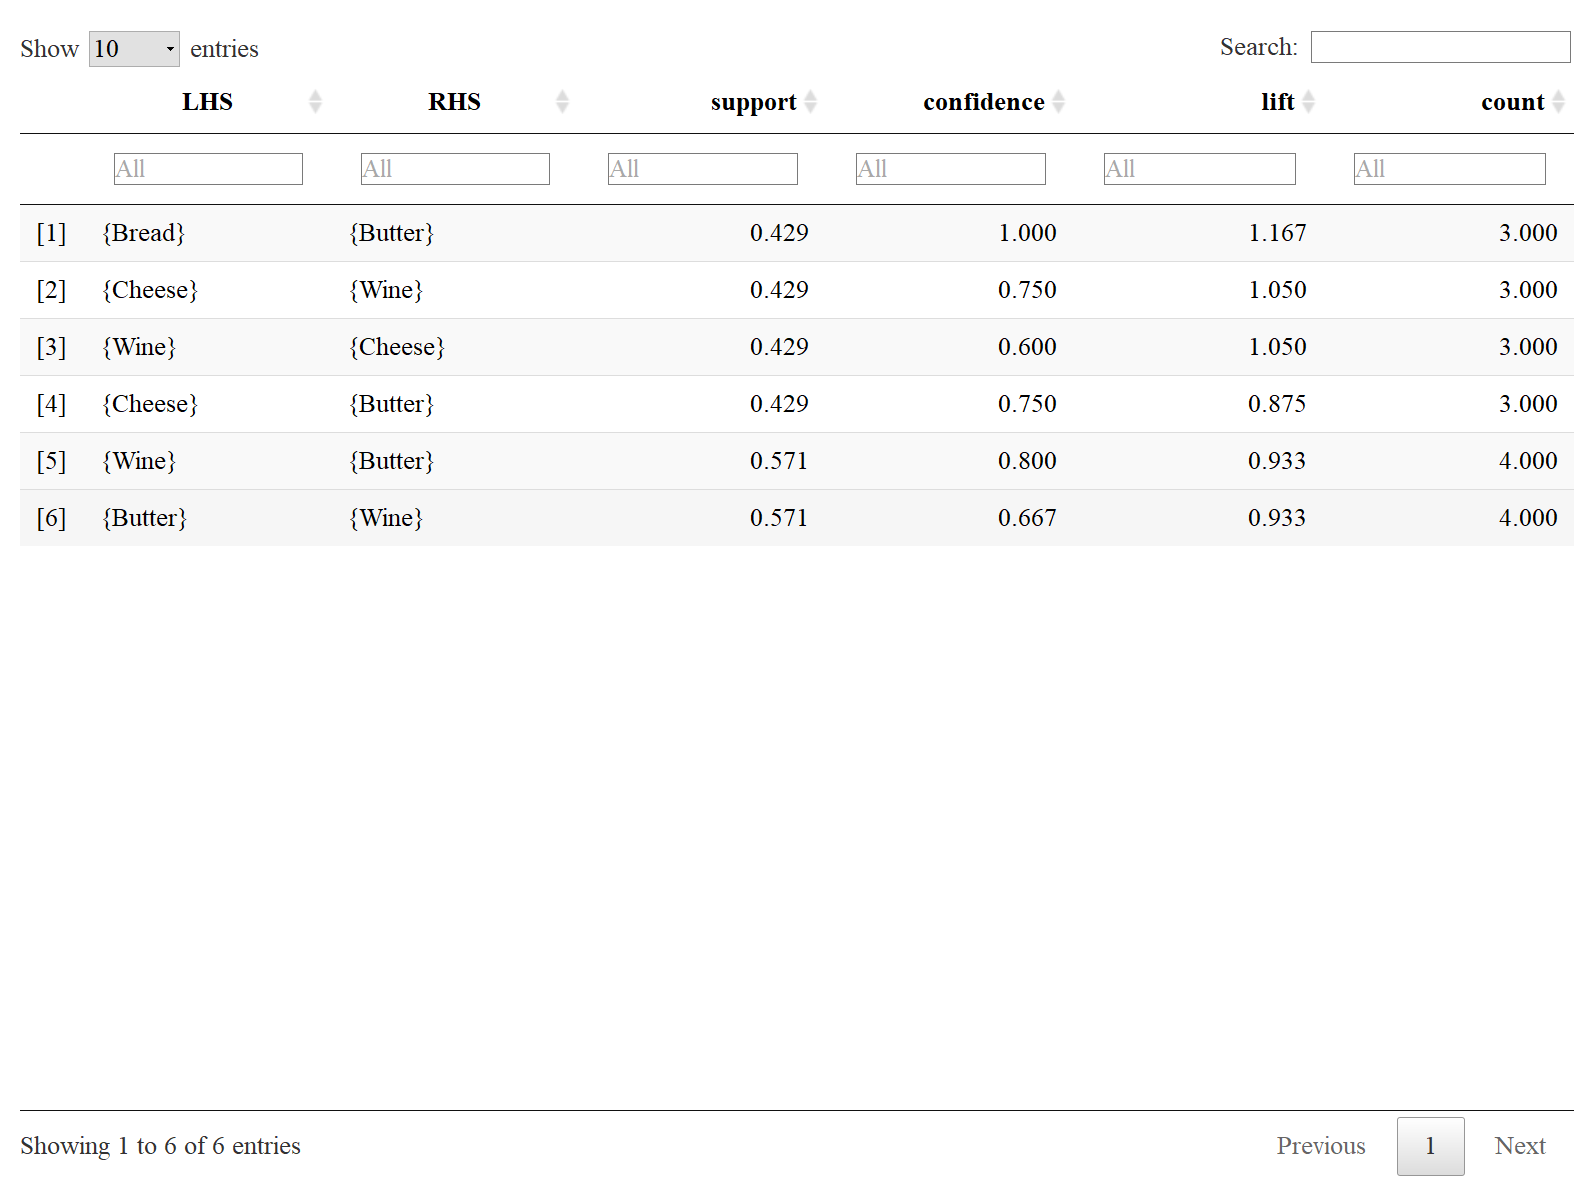
Interaktiv tabell med mätvärden

Regler från mataffären

library(arules)
rules = apriori(data_trx, 
                parameter = list(
                  supp = 3/7, conf=0.6, minlen=2)
                )
inspect(rules)

Interaktiv tabell

library(arulesViz)
inspectDT(rules)

HTML-tabell

inspect_DT_rule

Kundkorgsanalys i R

Introduktion till spridningsdiagram

Granskning av reglerna

inspect(rules)
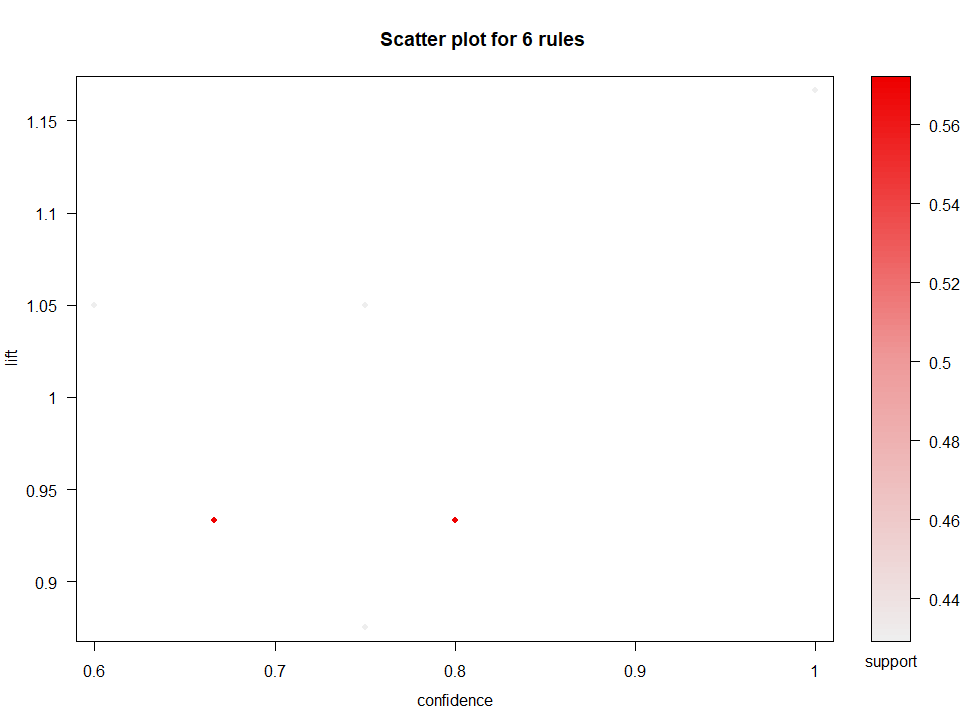
    lhs         rhs      support   confidence lift      count
[1] {Bread}  => {Butter} 0.4285714 1.0000000  1.1666667 3    
[2] {Cheese} => {Wine}   0.4285714 0.7500000  1.0500000 3    
[3] {Wine}   => {Cheese} 0.4285714 0.6000000  1.0500000 3    
[4] {Cheese} => {Butter} 0.4285714 0.7500000  0.8750000 3    
[5] {Wine}   => {Butter} 0.5714286 0.8000000  0.9333333 4    
[6] {Butter} => {Wine}   0.5714286 0.6666667  0.9333333 4

Spridningsdiagram från arulesViz

plot(rules)
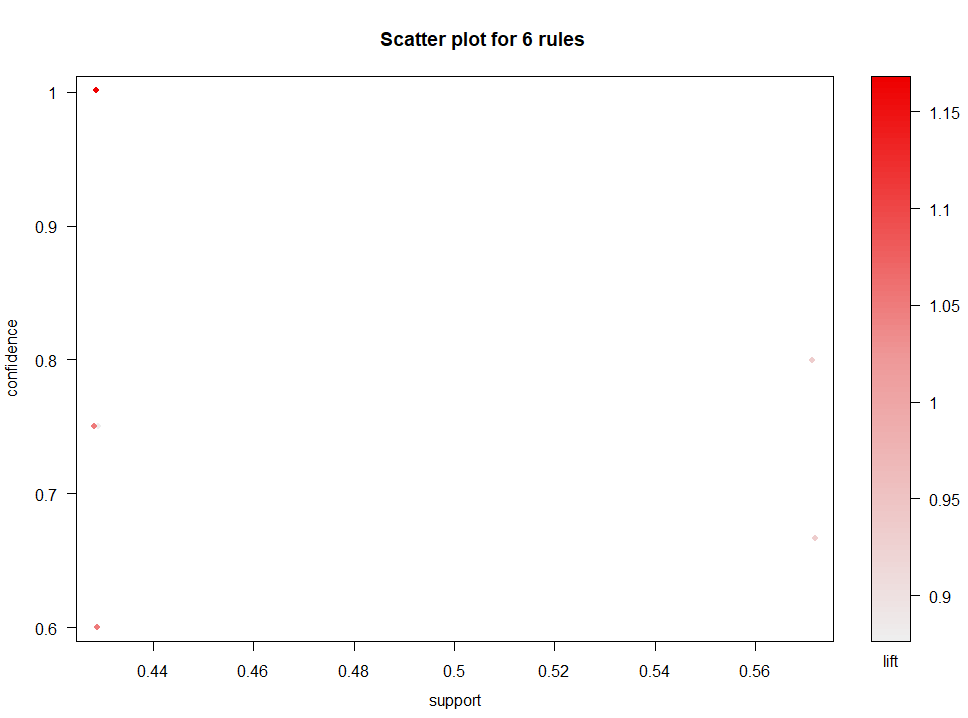
scatter_grocery

Kundkorgsanalys i R

Flexibla arules-plottar

Alternativ för plot

plot(rulesObject, measure, shading, method)
  • rulesObject: regelobjektet som ska plottas
  • measure: mätvärden för regelns intressanthet (Support, Confidence, lift, ...)
  • shading: mätvärde för punkternas färgsättning.
  • method: visualiseringsmetod ("scatterplot", "matrix", "two-key plot", "matrix3D")

Exempel

plot(rules, measure = c("confidence", "lift"),
     shading = "support",
     method = "scatterplot")
scatter_grocery_plot

Kundkorgsanalys i R

Andra arules-plottar

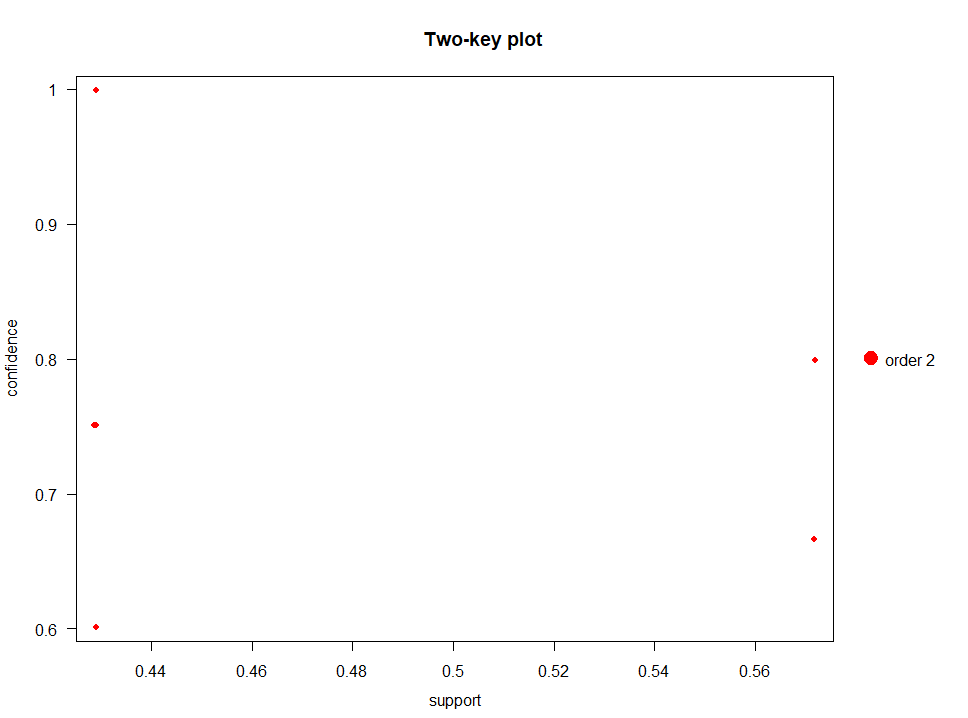
Two-key plot

plot(rules, method = "two-key plot")

two_key_plot

Kundkorgsanalys i R

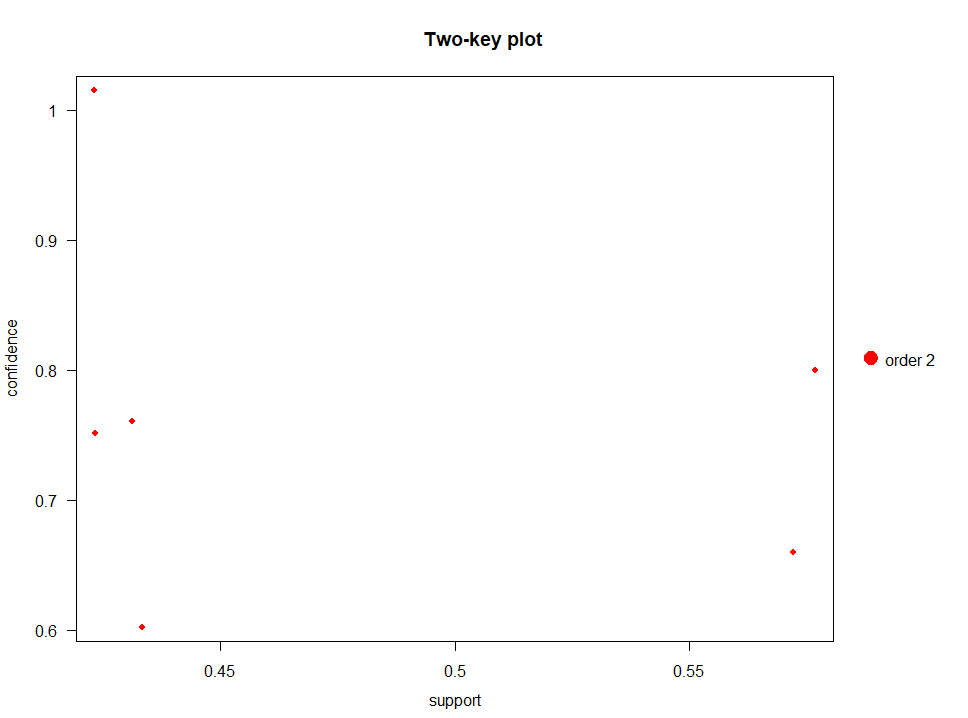
Jitter i dina plottar

Utan jitter

plot(rules, method = "two-key plot")

two_key_plot

Med jitter

plot(rules, method = "two-key plot",jitter = 2)
two_key_plot_jitter

Kundkorgsanalys i R

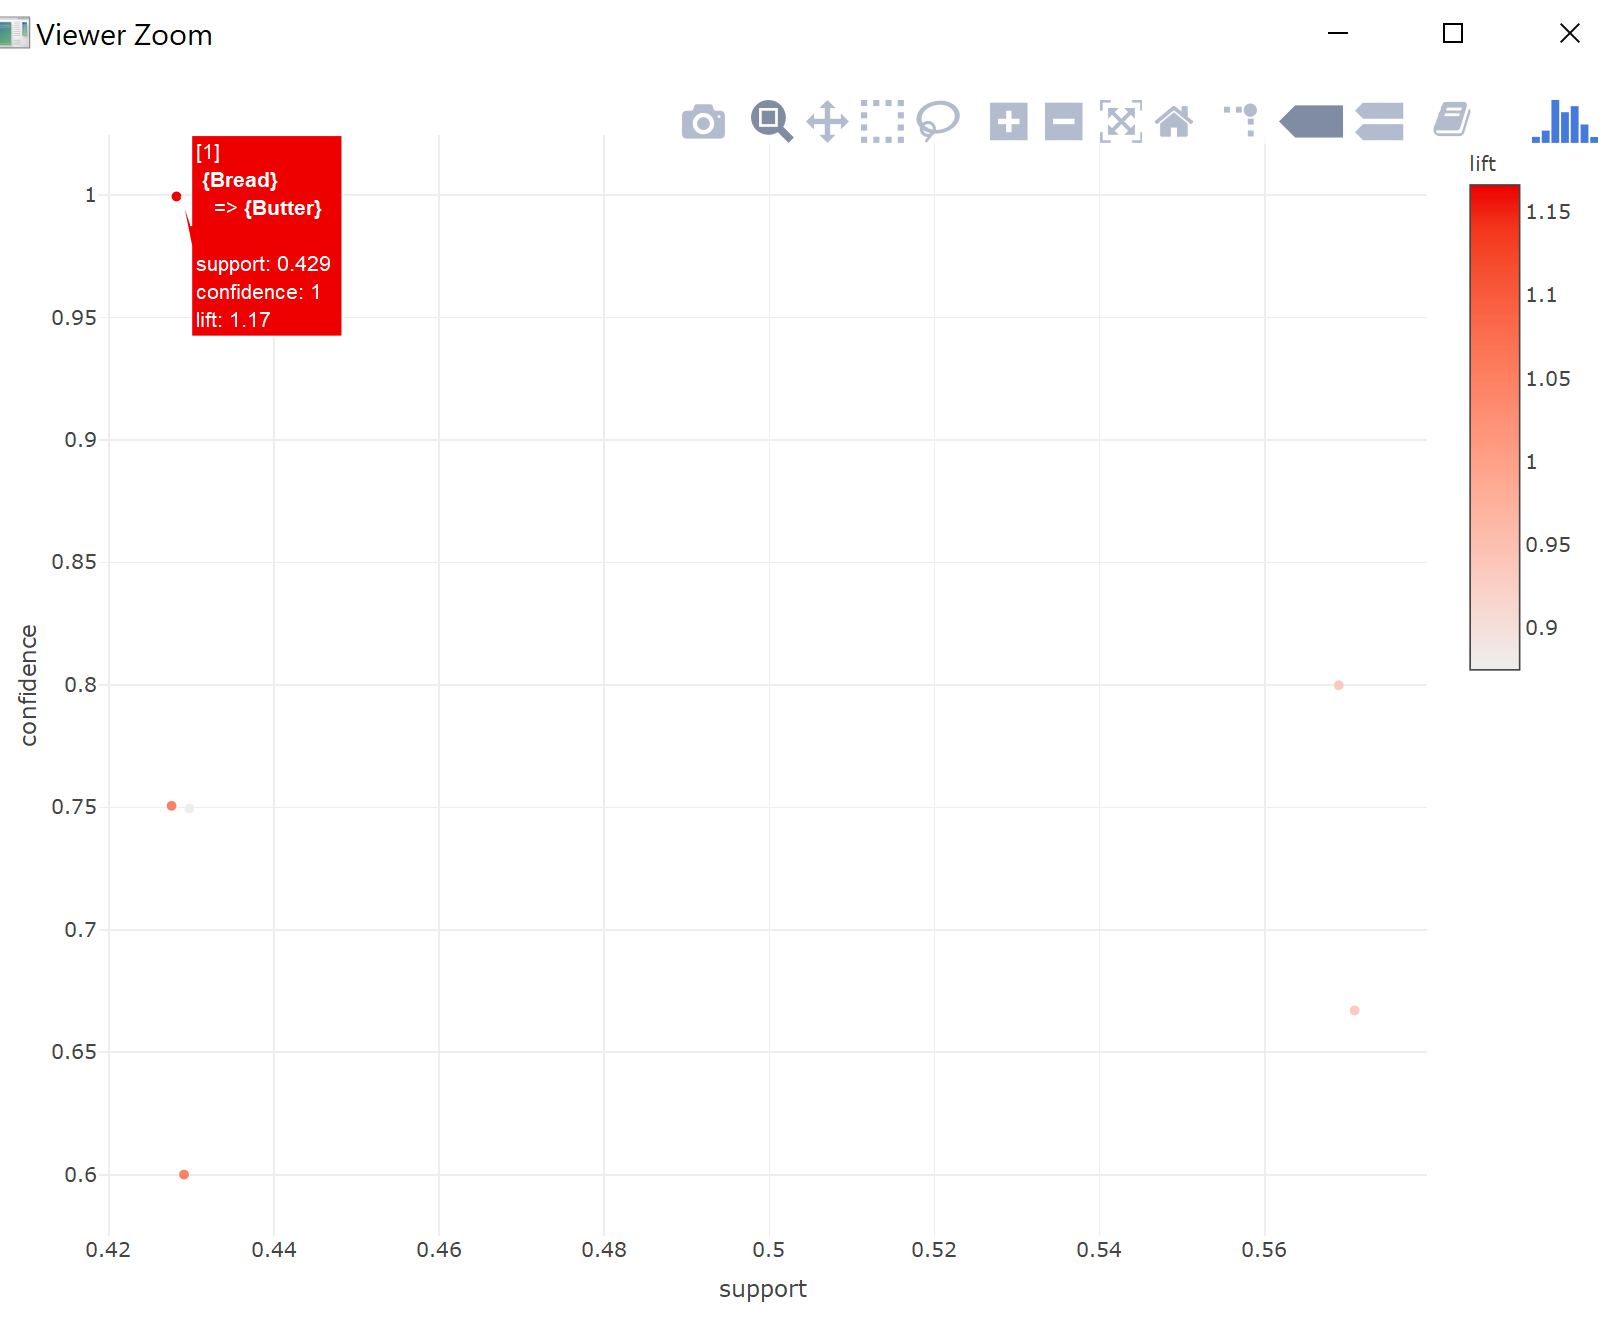
Interaktiva arules-plottar

Interaktiva regler

plot(rules, engine = "plotly")

Från statisk till interaktiv

rules_plotly

Kundkorgsanalys i R

Nu kör vi en övning!

Kundkorgsanalys i R

Preparing Video For Download...