Visualisera transaktioner och regler

Kundkorgsanalys i R

Christopher Bruffaerts

Statistician

Interaktiv inspektion

Regelutvinning

rules = apriori(Groceries, 
                parameter = list(
                  supp=.001,
                  conf=.5,
                  minlen=2,
                  target='rules'
                 ))
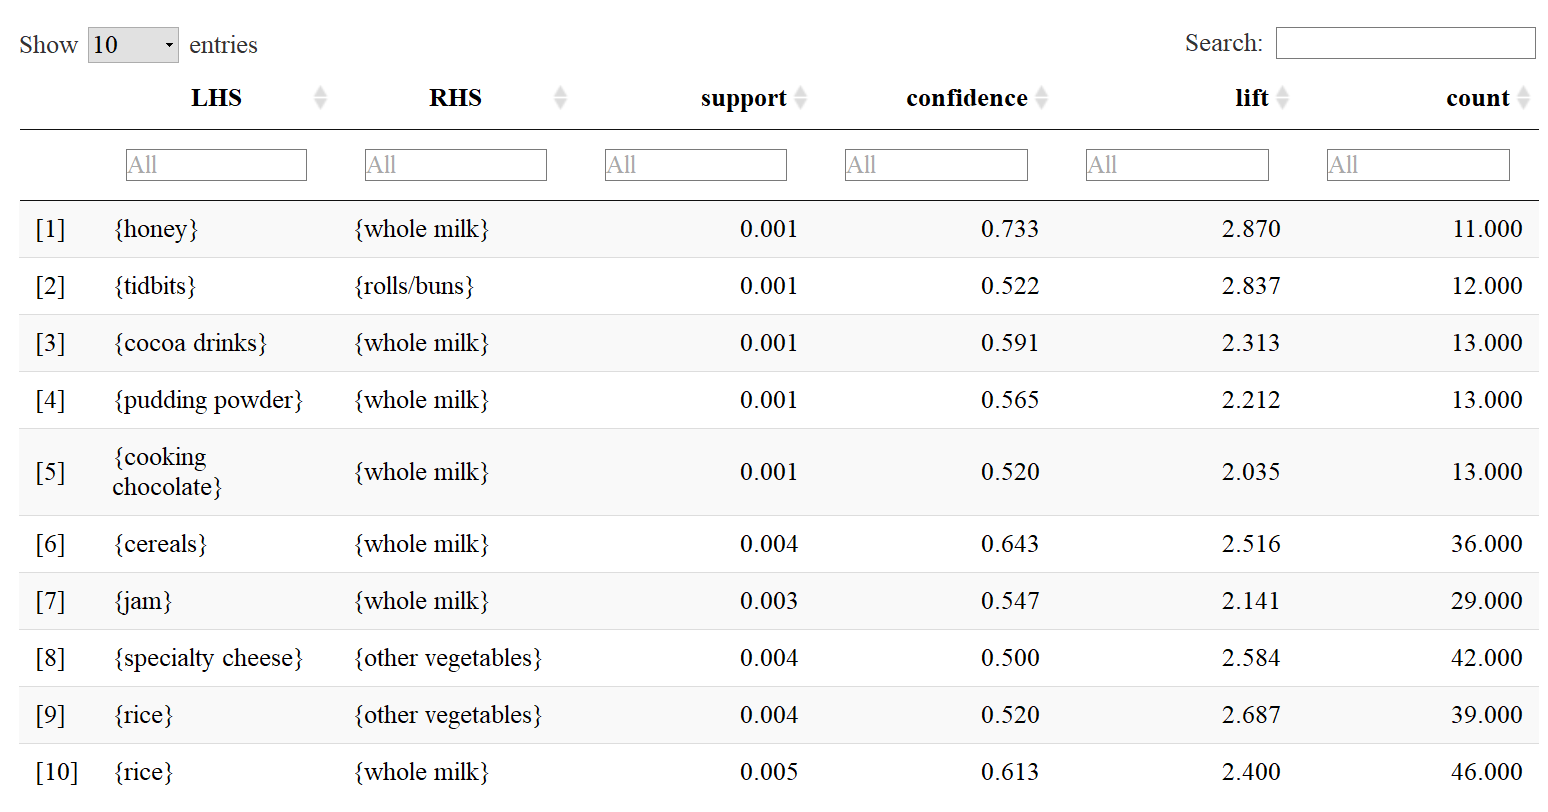
# Datatable inspection
inspectDT(rules)

HTML-tabell

DT_groceries

Kundkorgsanalys i R

Interaktiva spridningsdiagram

Graf från arulesViz

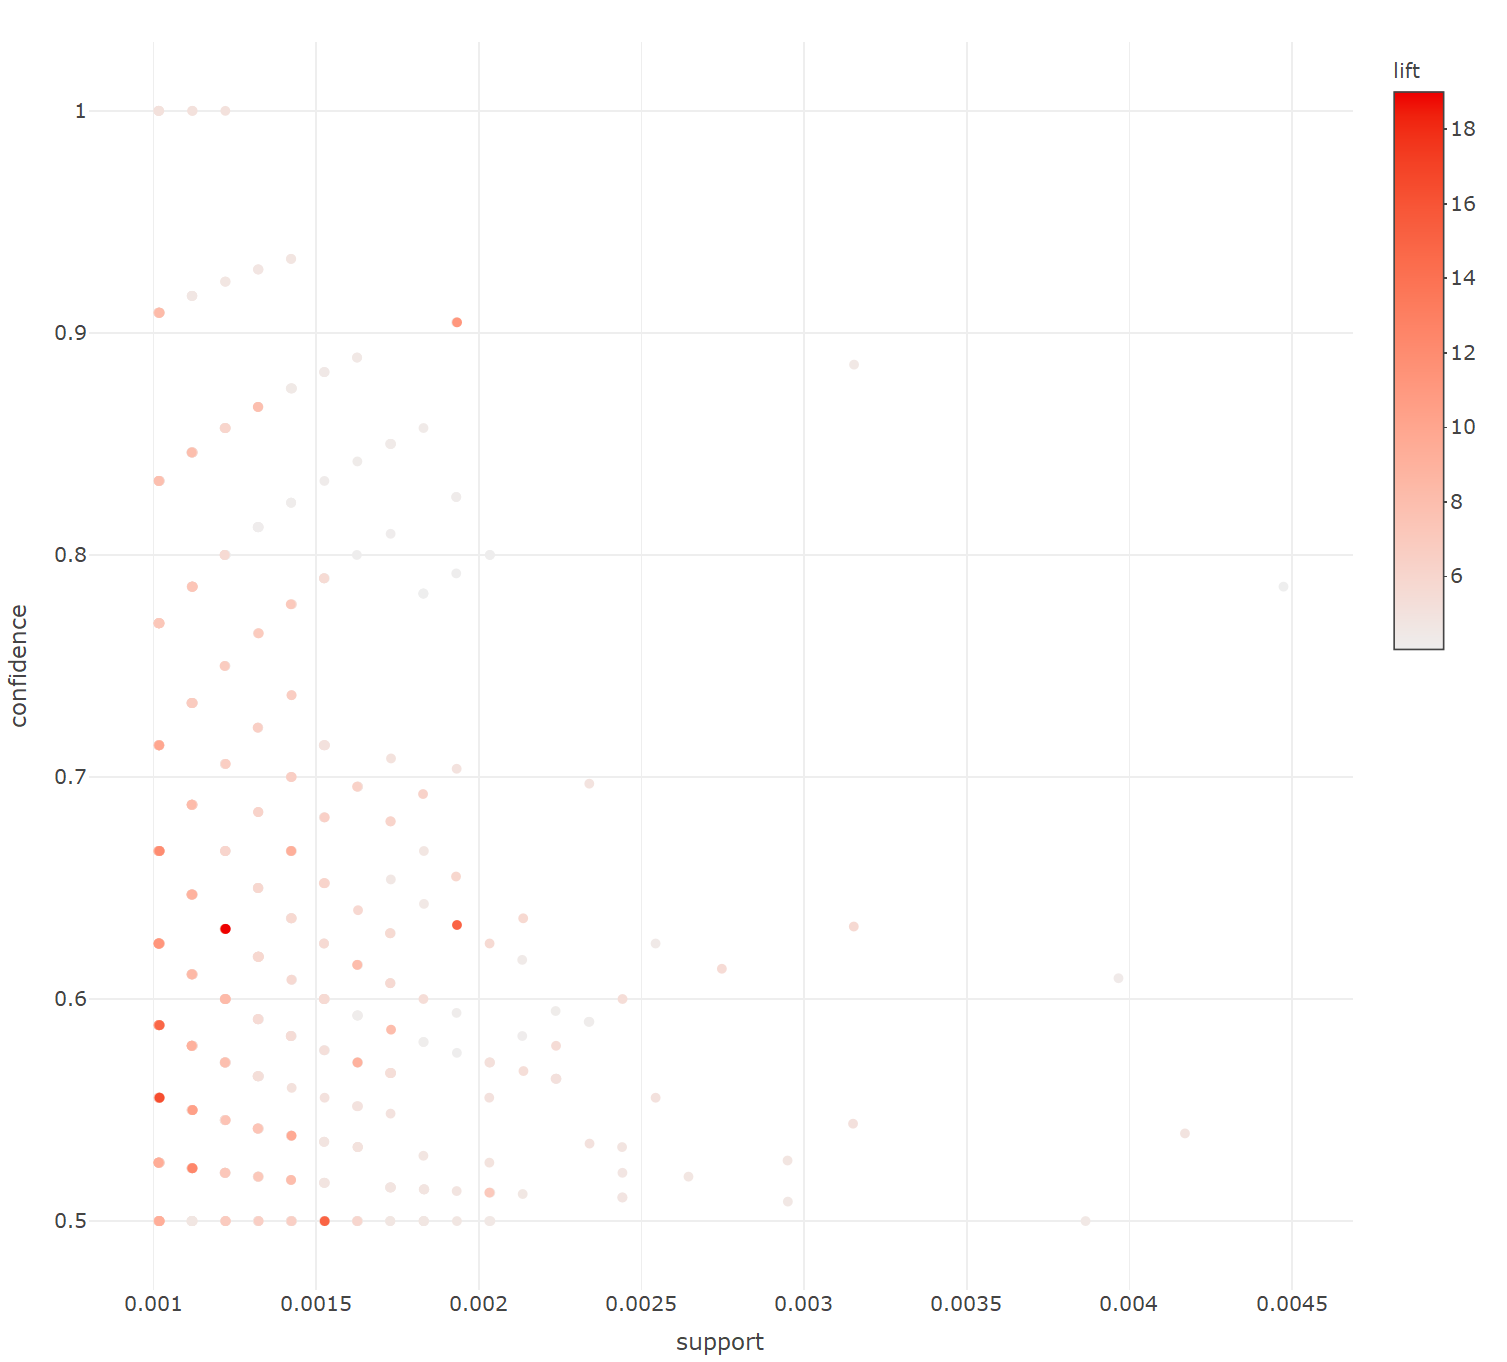
# Plot rules as scatterplot
plot(rules, method = "scatterplot",
     engine = "html")

Andra diagramtyper med method:

  • two-key plot
  • grouped
  • matrix

Spridningsdiagram och andra

Groceries_interactive_scatter

Kundkorgsanalys i R

Interaktiva grafer

Motor och metod

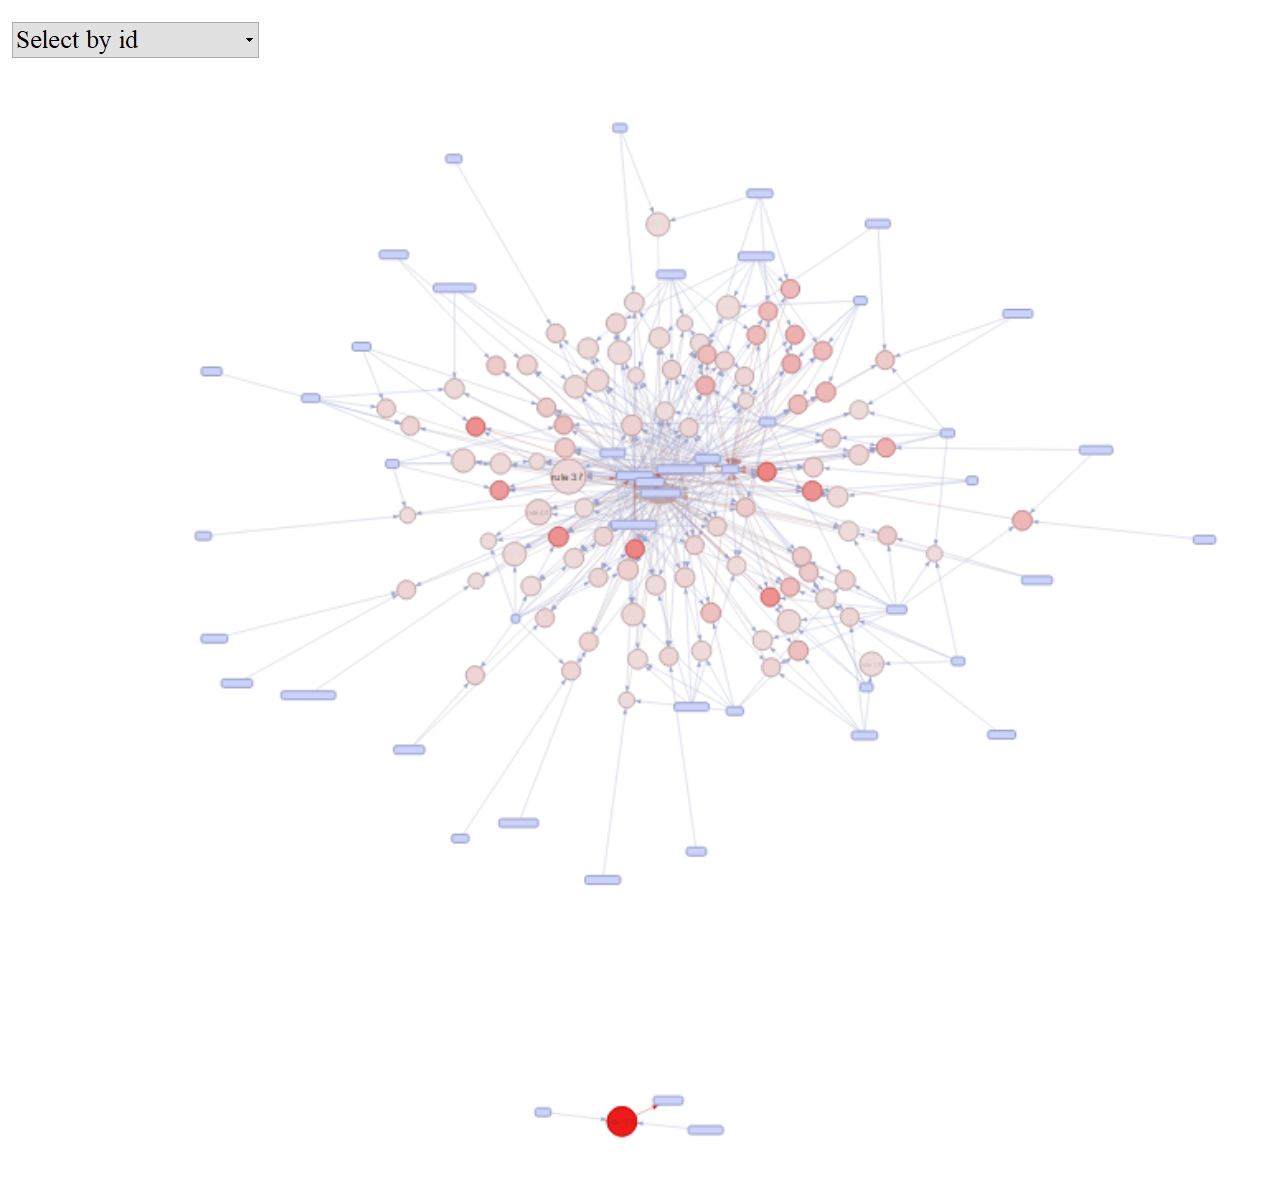
# Plot rules as graph
plot(rules, method = "graph",
     engine = "html")

graph_groceries

Kundkorgsanalys i R

Interaktiva undergrafer

Sortera utvunna regler

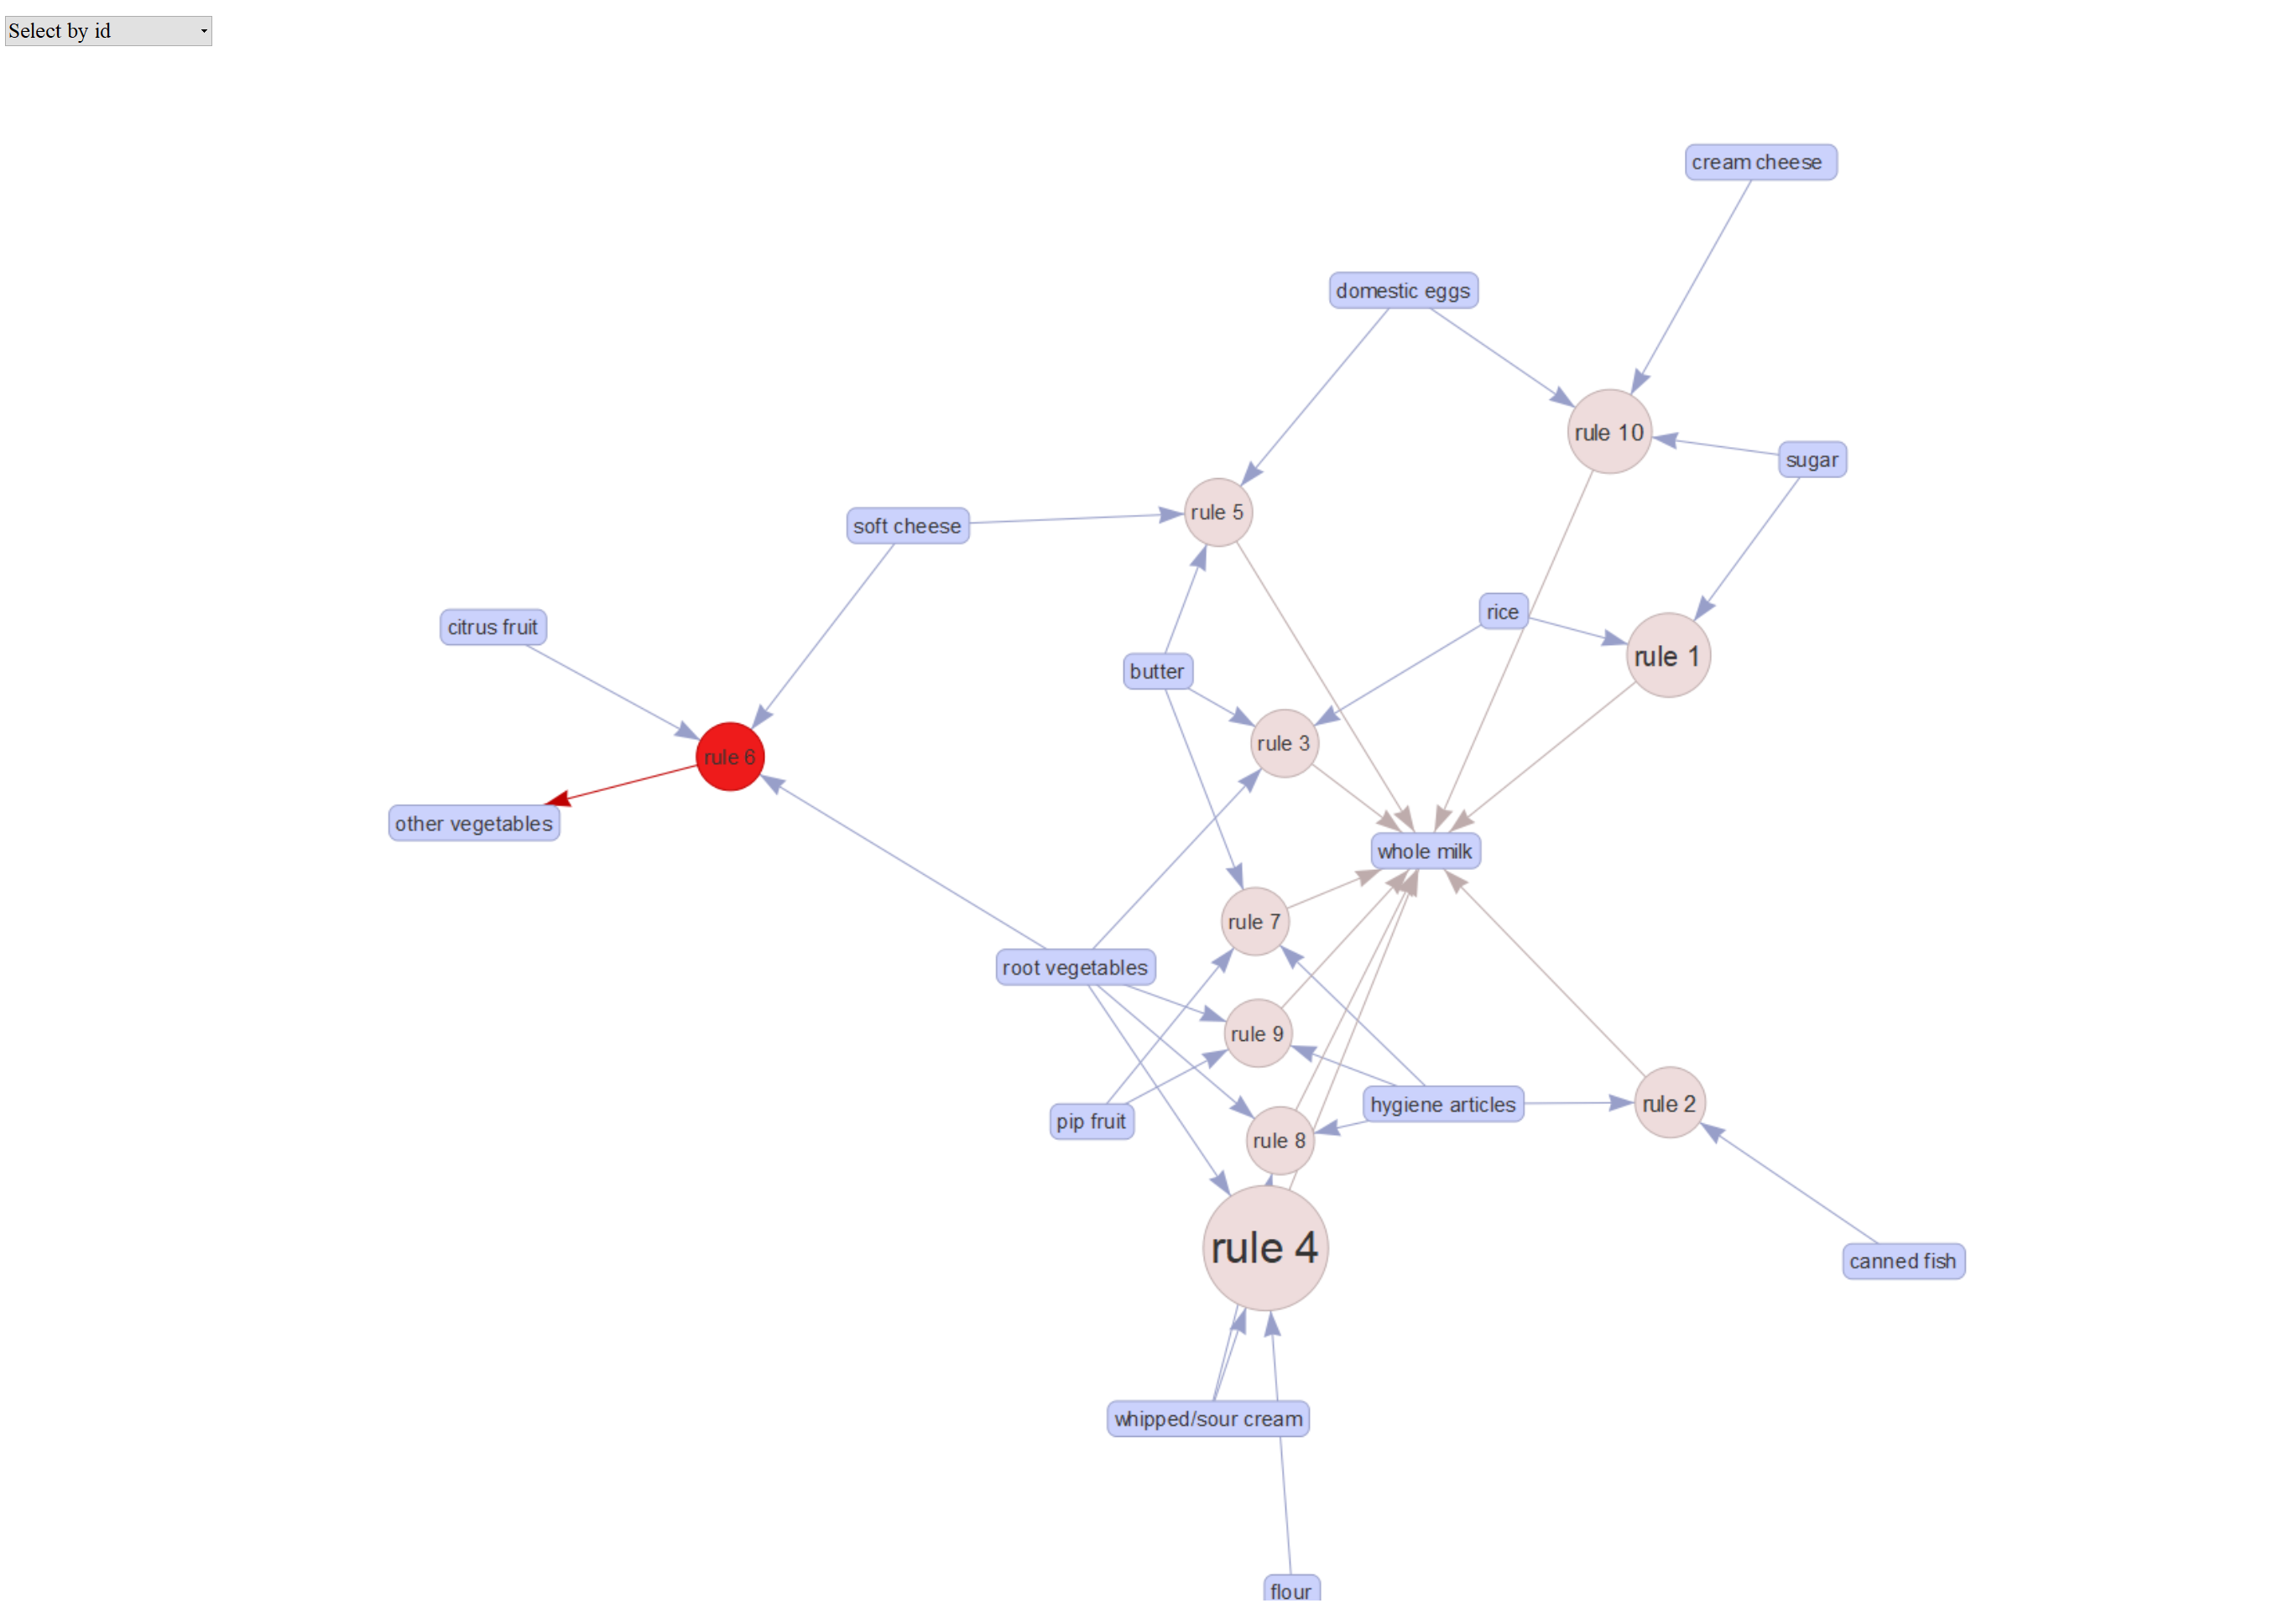
# Top 10 rules with highest confidence
top10_rules_Groceries = 
    head(sort(rules,by = "confidence"), 10)
inspect(top10_rules_Groceries)
# Plot the top 10 rules
plot(top10_rules_Groceries, 
     method = "graph",  engine = "html")

subgraph_groceries

Kundkorgsanalys i R

Utforska regler i Groceries

rules = apriori(Groceries, parameter=list(supp=0.001, conf=0.8))
ruleExplorer(rules)
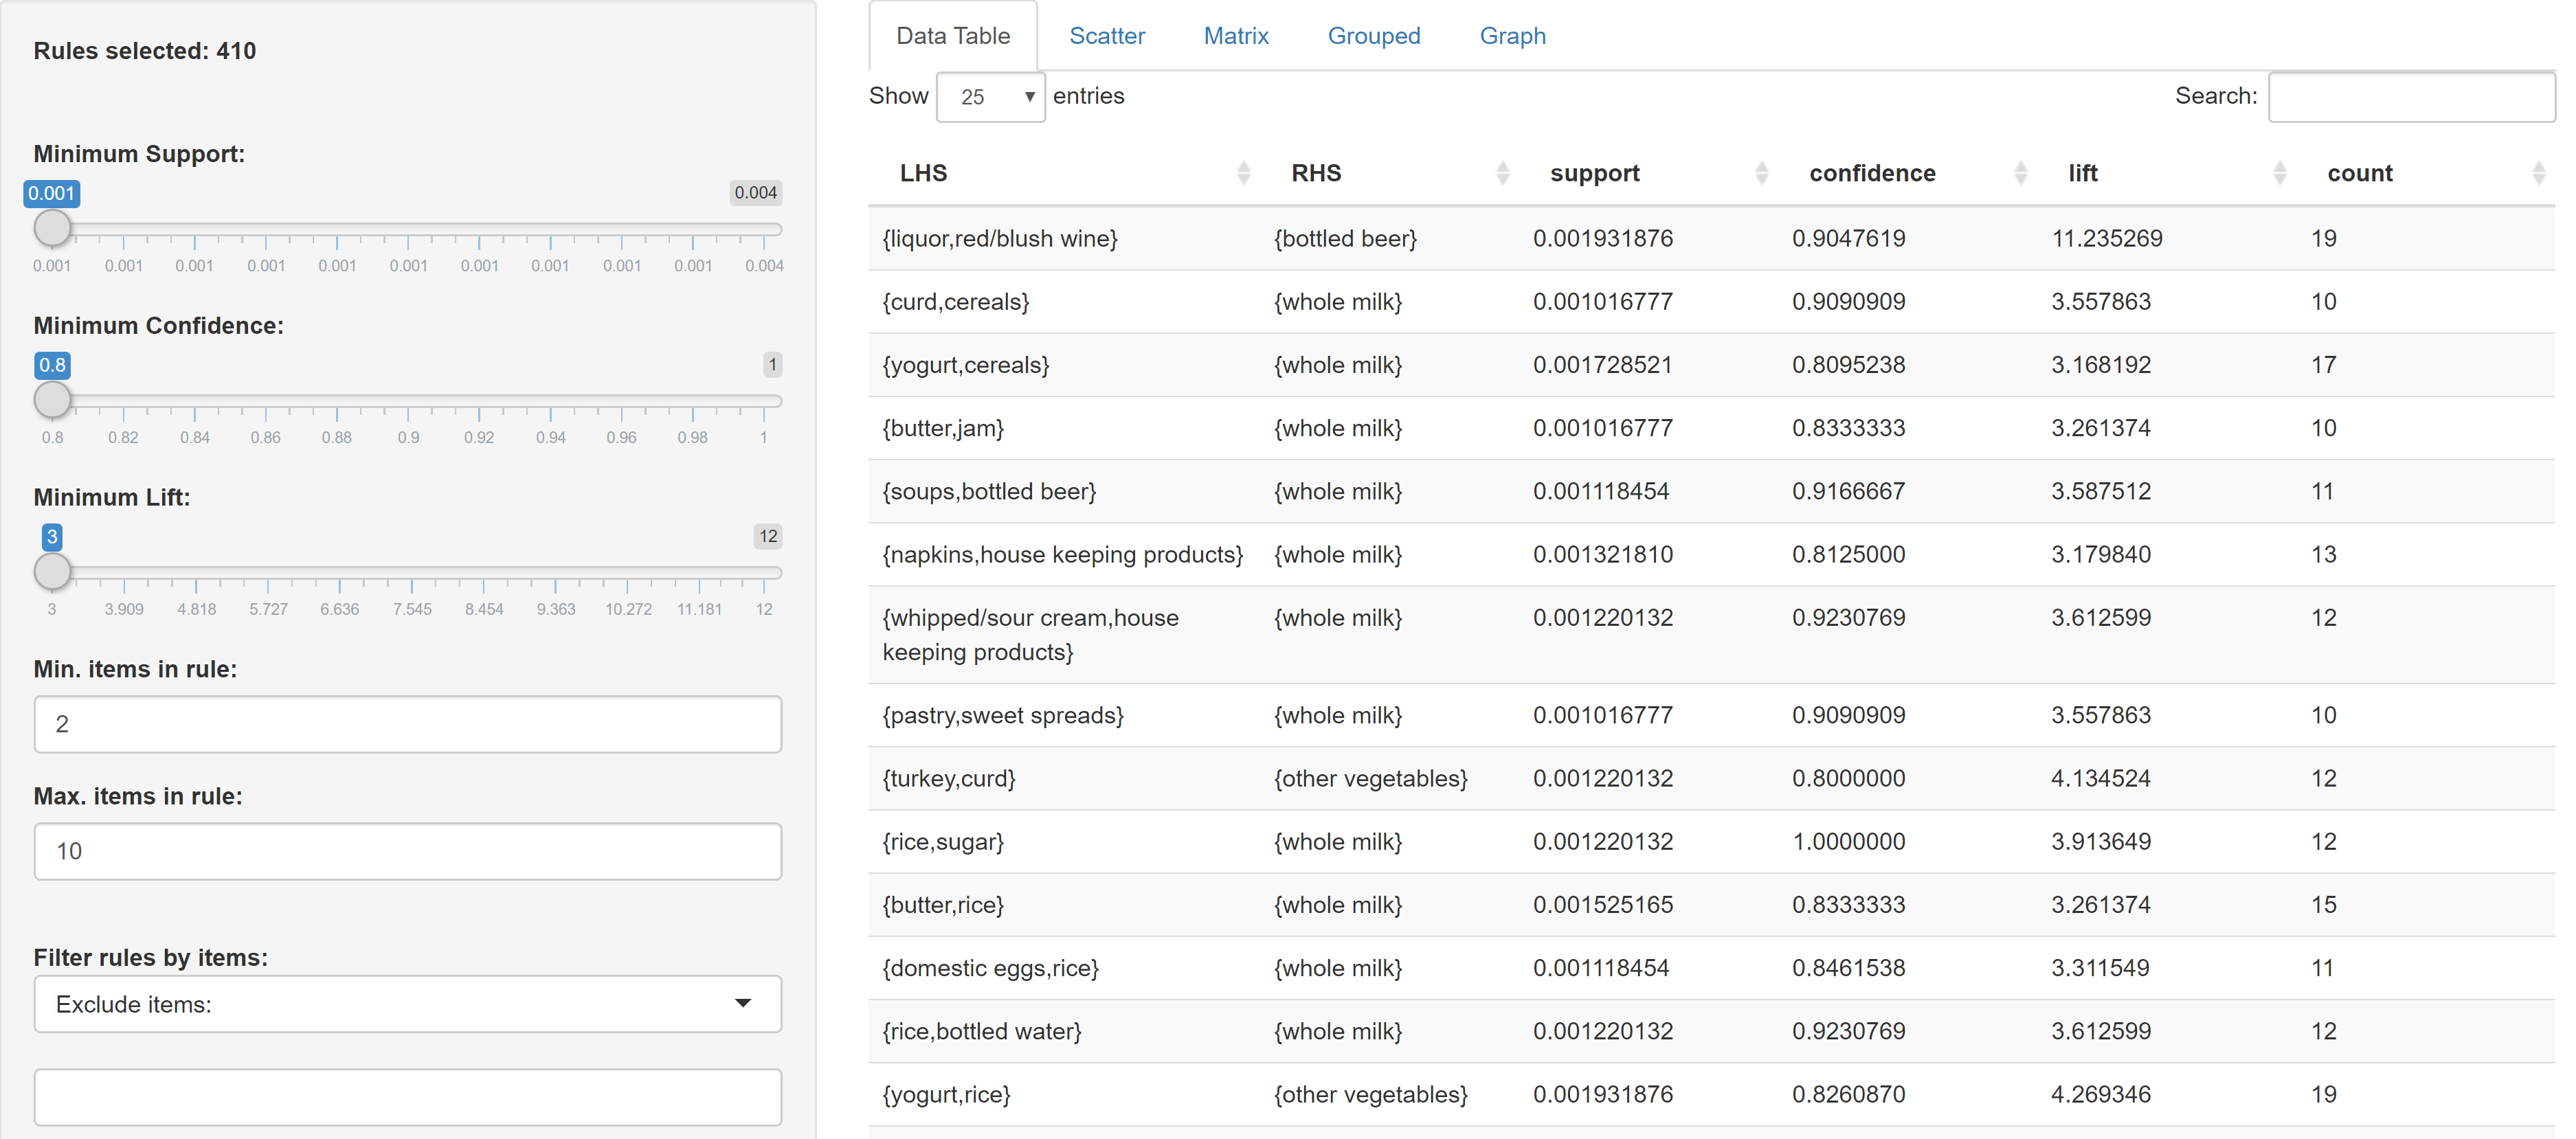
shiny_groceries

Kundkorgsanalys i R

Nu kör vi en övning!

Kundkorgsanalys i R

Preparing Video For Download...