การจัดกลุ่มและโมเดลคลัสเตอร์
การจำลองเหตุการณ์แบบไม่ต่อเนื่องด้วย Python

Diogo Costa (PhD, MSc)
Adjunct Professor, University of Saskatchewan, Canada & CEO of ImpactBLUE-Scientific
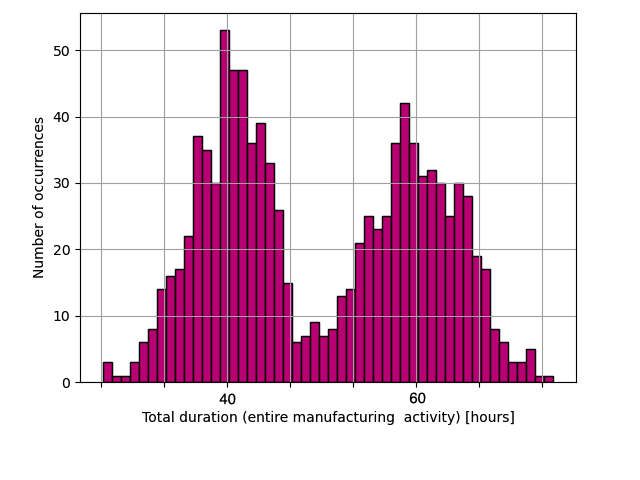
Histogram ของผลลัพธ์โมเดล
การใช้งาน: สร้าง histogram จากชุดข้อมูล data โดยใช้ 50 bins
plt.hist(data, bins=50)
การวิเคราะห์คลัสเตอร์และการประยุกต์ใช้กับโมเดล
- การประยุกต์ใช้
- การจดจำรูปแบบ (เช่น ผลลัพธ์ของโมเดล)
- การวิเคราะห์ภาพ

- การบีบอัดข้อมูล
- คอมพิวเตอร์กราฟิกส์
Machine learning

ในโมเดล discrete-event
- ระบุรูปแบบผลลัพธ์ของโมเดล
- ได้ข้อมูลที่นำไปใช้งานได้จริงมากขึ้น
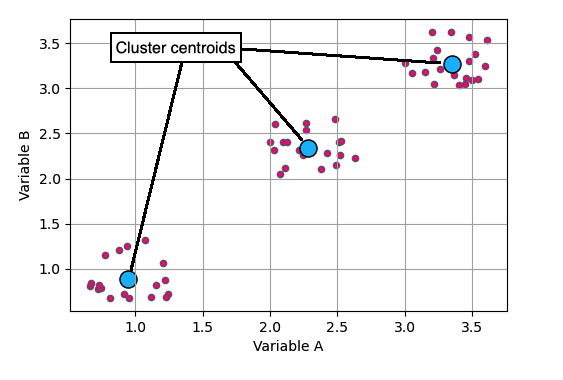
k-means clustering
การสังเกตและ cluster centroids
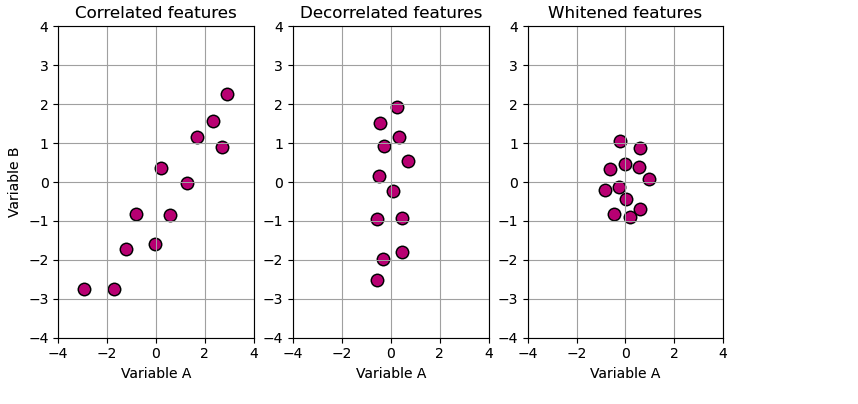
Data whitening: การลบความสัมพันธ์และการปรับขนาด
ก่อนรัน k-means: Data whitening
- ลบความสัมพันธ์ในข้อมูล
obs - ปรับขนาดแต่ละมิติของ
obsด้วยส่วนเบี่ยงเบนมาตรฐาน
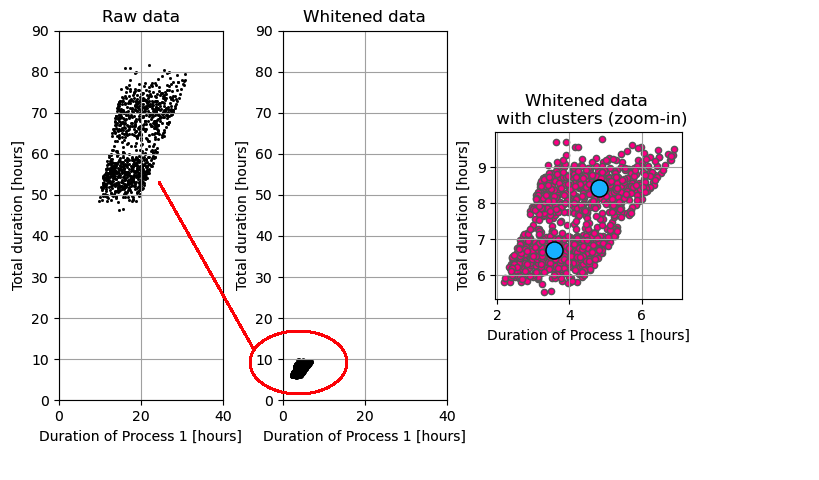
ตัวอย่าง whitening และ k-means
- กิจกรรมการผลิตที่มีหลายกระบวนการ
- มาดูผลกระทบของ
Process 1