แบบจำลองทางคณิตศาสตร์ของระบบพลวัต
การจำลองเหตุการณ์แบบไม่ต่อเนื่องด้วย Python

Diogo Costa (PhD, MSc)
Adjunct Professor, University of Saskatchewan, Canada & CEO of ImpactBLUE-Scientific
แบบจำลองทางคณิตศาสตร์คืออะไร?
แบบจำลองทางคณิตศาสตร์อาจเรียบง่ายหรือซับซ้อนก็ได้
- เป็นการประมาณความเป็นจริงในรูปแบบดิจิทัล
- ไม่สามารถคำนึงถึงทุกกระบวนการได้
George Box: "All models are wrong, but some are useful."
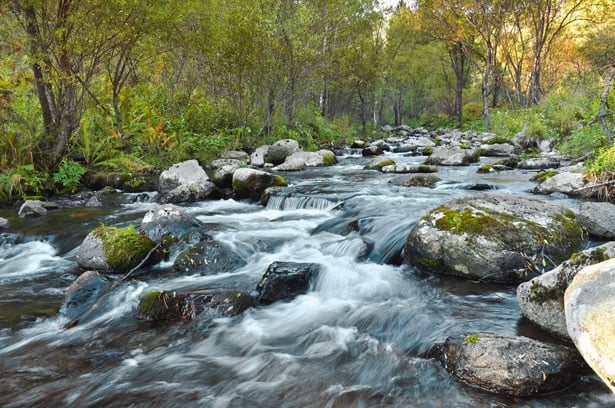
ตัวอย่าง: โมเดลพยากรณ์กระบวนการทางธรรมชาติ
แบบจำลองการไหลในแม่น้ำ
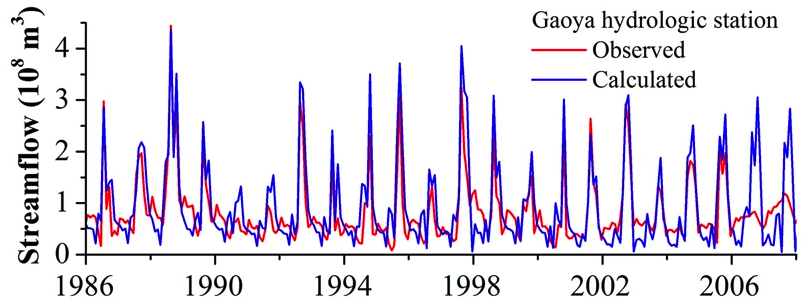
โมเดลนี้พยากรณ์ปริมาณน้ำท่าสำหรับสถานีอุทกวิทยา Goaya ในประเทศจีน
การพยากรณ์อิงข้อมูลปริมาณน้ำฝนที่ใช้เป็น input ของโมเดล
1 Chen, C., He, W., Zhou, H. et al. A comparative study among machine learning and numerical models for simulating groundwater dynamics in the Heihe River Basin, northwestern China. Sci Rep 10, 3904 (2020). https://doi.org/10.1038/s41598-020-60698-9
ตัวอย่าง: โมเดลพยากรณ์กิจกรรมที่มนุษย์ขับเคลื่อน
การพยากรณ์เงินเฟ้อ
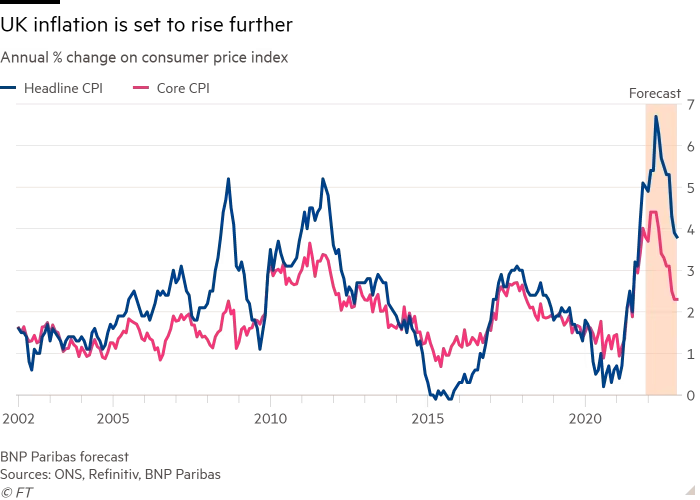
- การพยากรณ์เงินเฟ้อมีความสำคัญอย่างยิ่งในการป้องกันวิกฤตเศรษฐกิจ
1 https://www.ft.com/content/218d35ab-b044-467a-bb62-0d17547a4350
การแสดงผลผลลัพธ์ของโมเดล
การแสดงผลผลลัพธ์ของโมเดลช่วยระบุรูปแบบและจุดเปลี่ยนสำคัญในระบบ
การแสดงผลควรสอดคล้องกับวัตถุประสงค์ของการจำลอง
มีไลบรารีสำหรับการแสดงผลที่มีประโยชน์มากมาย:
matplotlib,seaborn,plotly