คำสั่ง plot

การสร้างโมเดลแบบไม่เชิงเส้นด้วย Generalized Additive Models (GAMs) ใน R

Noam Ross

Senior Research Scientist, EcoHealth Alliance
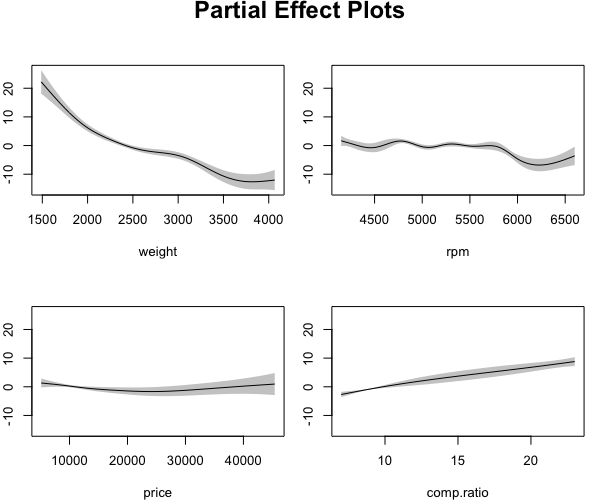
คำสั่ง plot

plot(gam_model)
?plot.gam
การสร้างโมเดลแบบไม่เชิงเส้นด้วย Generalized Additive Models (GAMs) ใน R

การสร้างโมเดลแบบไม่เชิงเส้นด้วย Generalized Additive Models (GAMs) ใน R

การเลือกผลบางส่วนที่ต้องการแสดง

plot(gam_model, select = c(2, 3))
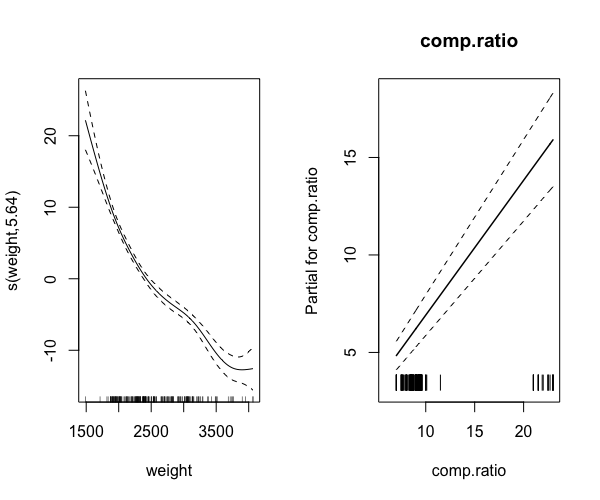
plot(gam_model, pages = 1)
plot(gam_model, pages = 1, all.terms = TRUE)
การสร้างโมเดลแบบไม่เชิงเส้นด้วย Generalized Additive Models (GAMs) ใน R

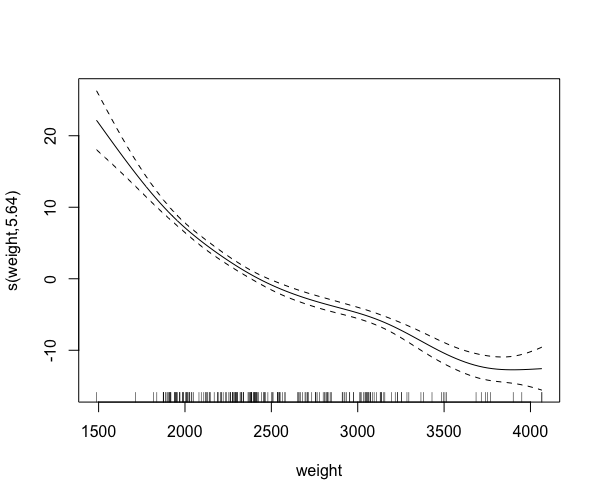
การแสดงข้อมูลบนกราฟ

plot(gam_model, rug = TRUE)
การสร้างโมเดลแบบไม่เชิงเส้นด้วย Generalized Additive Models (GAMs) ใน R

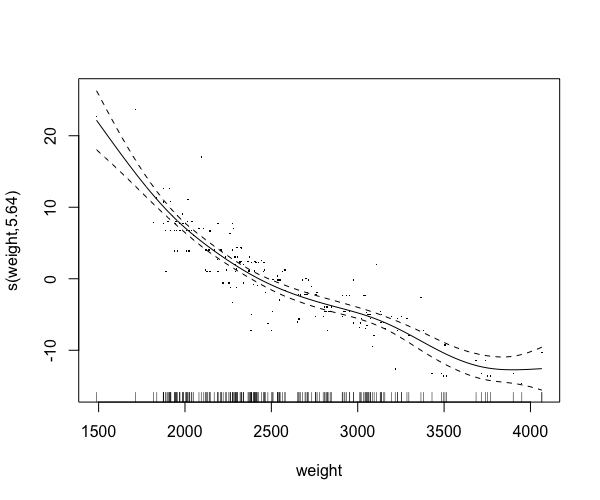
การแสดงข้อมูลบนกราฟ (2)

plot(gam_model, residuals = TRUE)
การสร้างโมเดลแบบไม่เชิงเส้นด้วย Generalized Additive Models (GAMs) ใน R

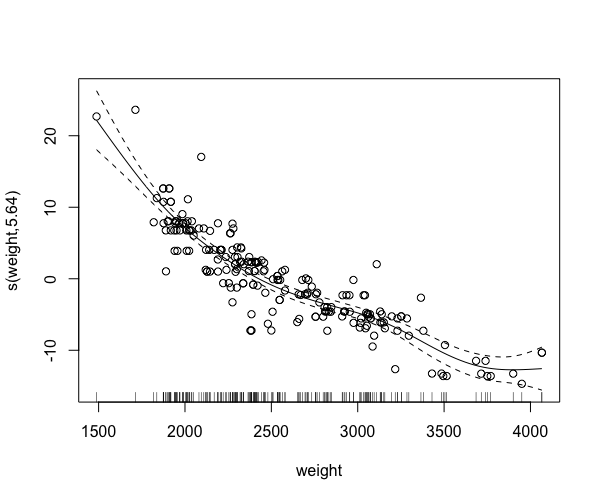
การแสดงข้อมูลบนกราฟ (3)

plot(gam_model, rug = TRUE, residuals = TRUE,
     pch = 1, cex = 1)
การสร้างโมเดลแบบไม่เชิงเส้นด้วย Generalized Additive Models (GAMs) ใน R

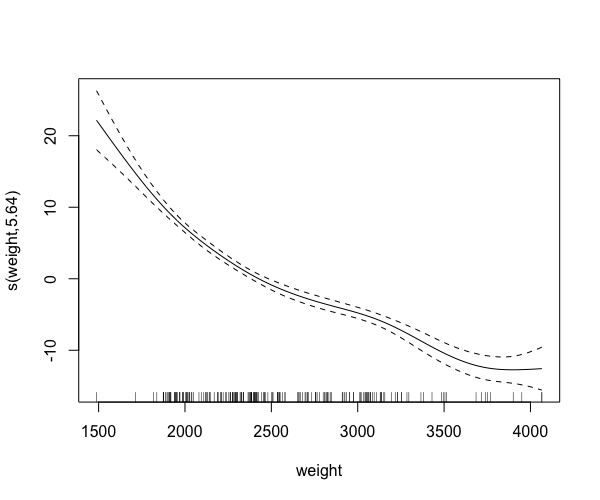
การแสดงค่าความคลาดเคลื่อนมาตรฐาน

plot(gam_model, se = TRUE)
การสร้างโมเดลแบบไม่เชิงเส้นด้วย Generalized Additive Models (GAMs) ใน R

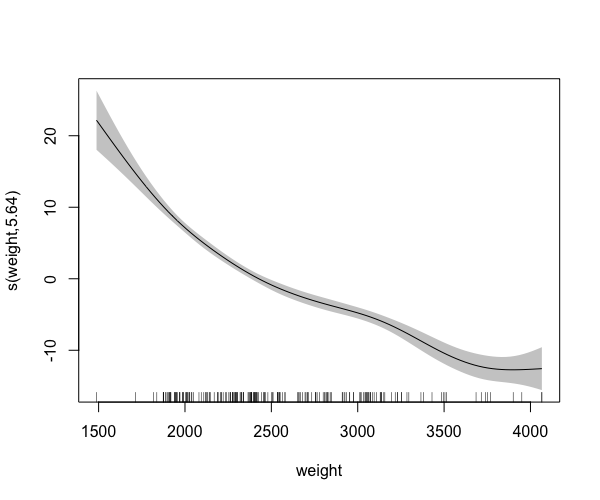
การแสดงค่าความคลาดเคลื่อนมาตรฐาน (2)

plot(gam_model, shade = TRUE)
การสร้างโมเดลแบบไม่เชิงเส้นด้วย Generalized Additive Models (GAMs) ใน R

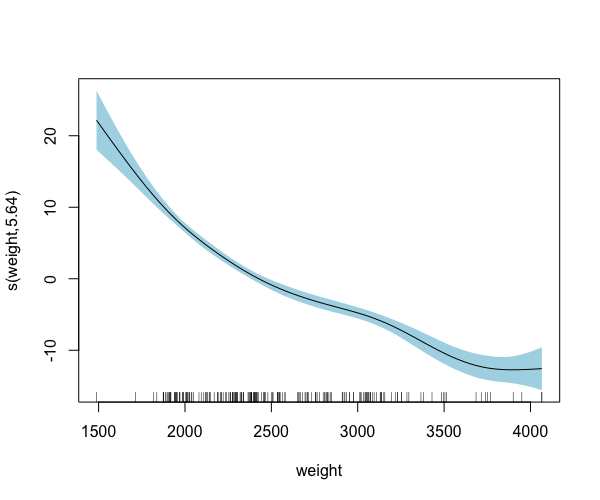
การแสดงค่าความคลาดเคลื่อนมาตรฐาน (3)

plot(gam_model, shade = TRUE, shade.col = "lightblue")
การสร้างโมเดลแบบไม่เชิงเส้นด้วย Generalized Additive Models (GAMs) ใน R

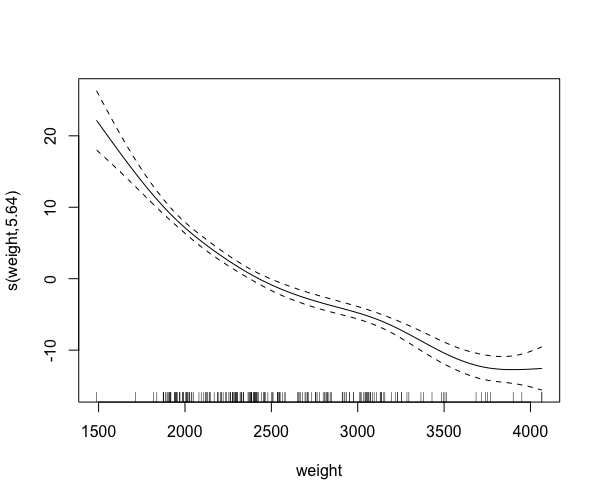
การแปลงค่าความคลาดเคลื่อนมาตรฐาน

plot(gam_model, seWithMean = TRUE)
การสร้างโมเดลแบบไม่เชิงเส้นด้วย Generalized Additive Models (GAMs) ใน R

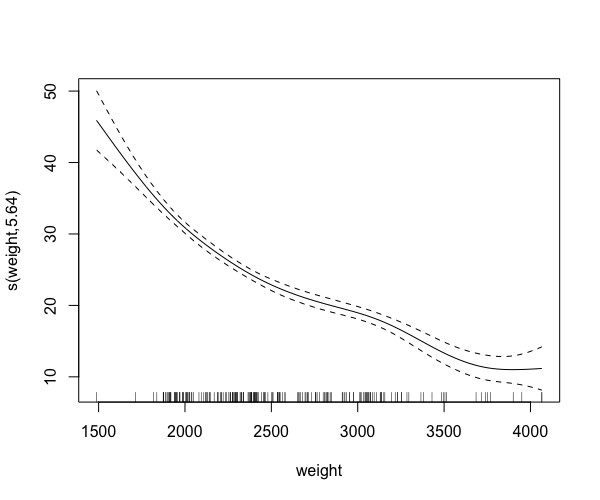
การแปลงค่าความคลาดเคลื่อนมาตรฐาน (2)

plot(gam_model, seWithMean = TRUE, shift = coef(gam_model)[1])
การสร้างโมเดลแบบไม่เชิงเส้นด้วย Generalized Additive Models (GAMs) ใน R

มาฝึกสร้างกราฟกันเถอะ!

การสร้างโมเดลแบบไม่เชิงเส้นด้วย Generalized Additive Models (GAMs) ใน R

Preparing Video For Download...