สร้างไดอะแกรมด้วย semPaths()
Structural Equation Modeling ด้วย lavaan ใน R

Erin Buchanan
Professor
ผลลัพธ์เริ่มต้นของ semPaths()
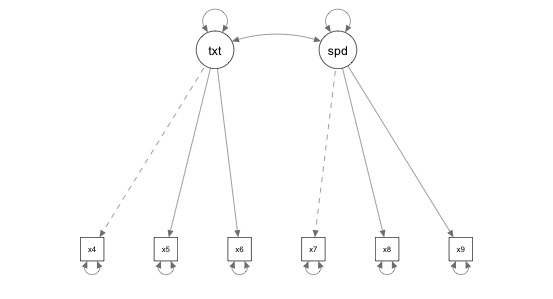
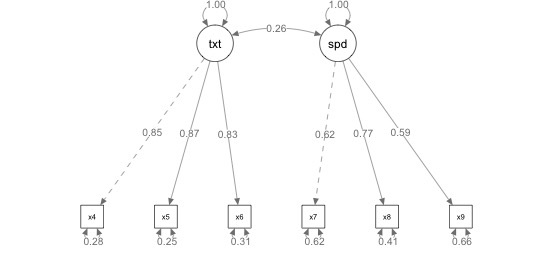
แก้ไขภาพ
semPaths(object = twofactor.fit,
         whatLabels = "std",
         edge.label.cex = 1)
#whatLabels can also be "par"
เลย์เอาต์ของภาพ
semPaths(object = twofactor.fit,
          whatLabels = "std",
          edge.label.cex = 1,
          layout = "circle")
#layout options are tree, circle, spring, tree2, circle2
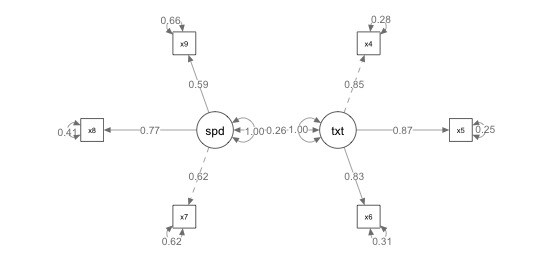
การหมุนภาพ
semPaths(object = twofactor.fit,
          whatLabels = "std",
          edge.label.cex = 1,
          layout = "tree", rotation = 2)
#rotation options are 1, 2, 3, 4 for tree layouts
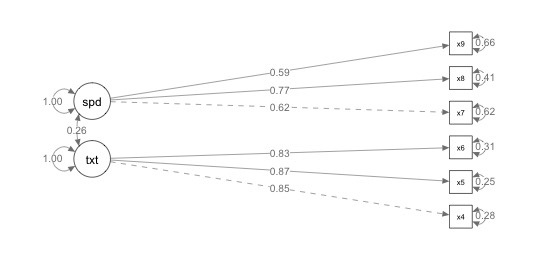
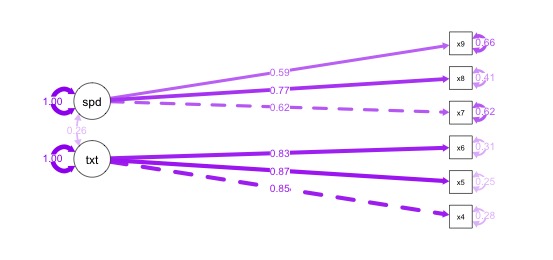
การแสดงสี
semPaths(object = twofactor.fit,
         whatLabels = "std",
         edge.label.cex = 1,
         layout = "tree", rotation = 2,
         what = "std", edge.color = "purple")
#what options include par and std