Spearman-rank correlation

A/B Testing ใน R

Lauryn Burleigh

Data Scientist

ข้อสมมติของ Spearman correlation

  • จัดลำดับอันดับ — เรียงตามตำแหน่ง
  • Spearman correlation สูง — ตำแหน่งของสองตัวแปรใกล้เคียงกัน
  • ข้อมูลแบบต่อเนื่องหรือแบบไม่ต่อเนื่อง
    • Ordinal, interval หรือ ratio

ภาพแท่งสี่แท่งเรียงจากสูงสุดไปต่ำสุด โดยแท่งสูงสุดมีอันดับที่ 1 และแท่งต่ำสุดมีอันดับที่ 4

A/B Testing ใน R

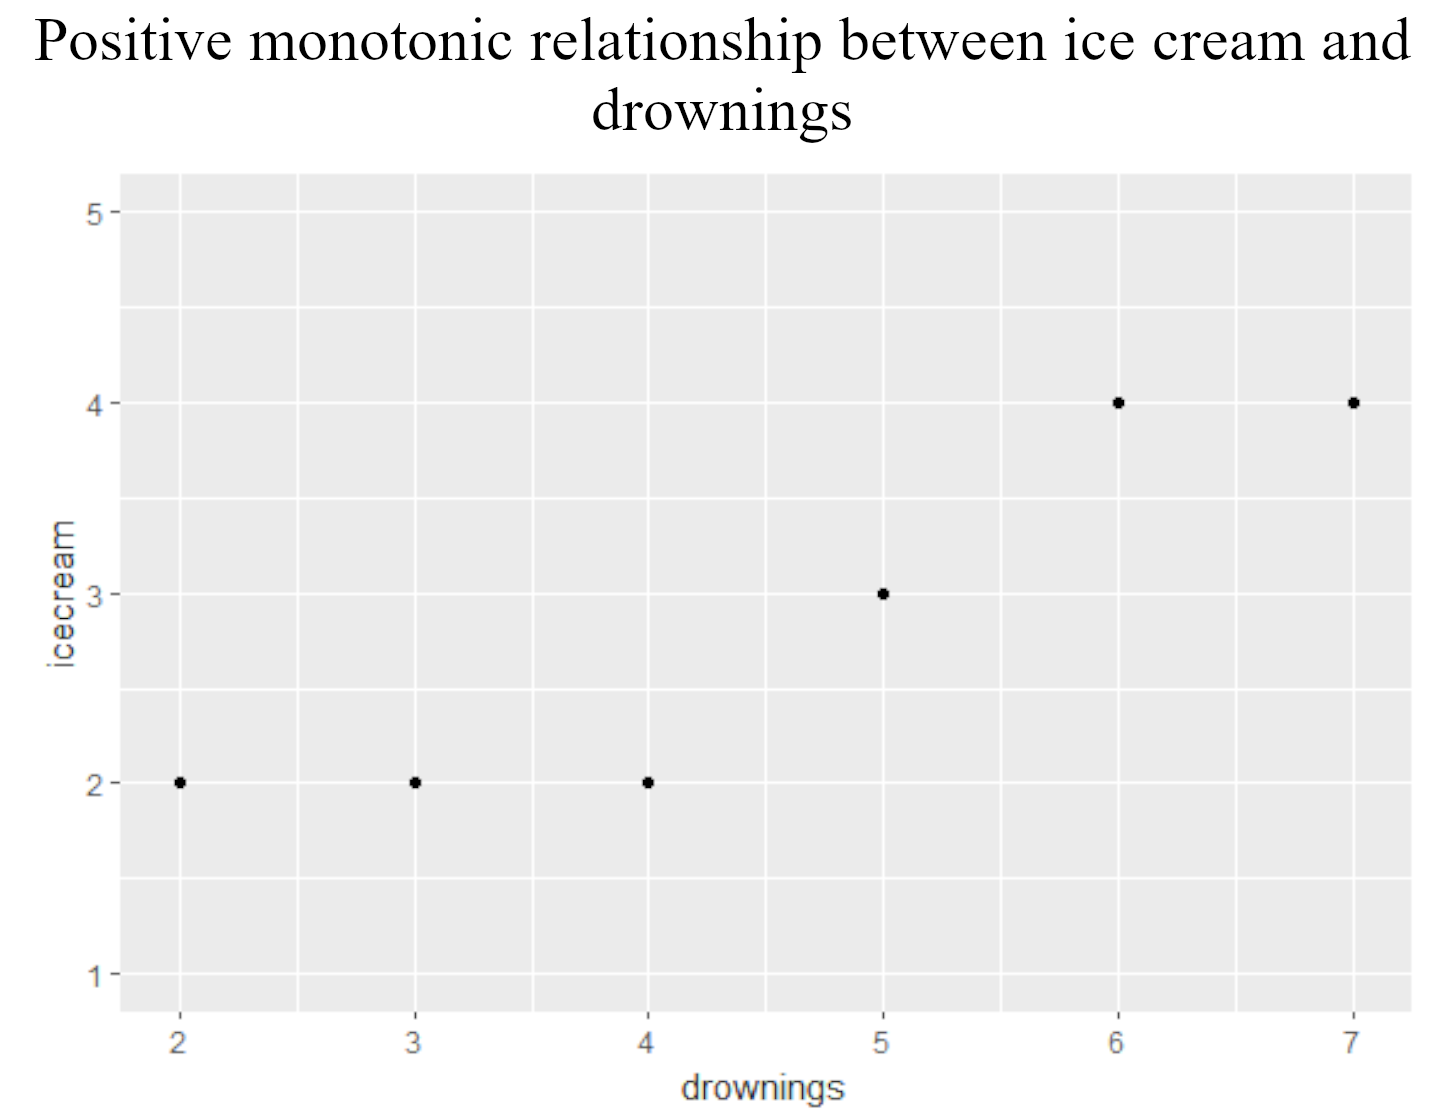
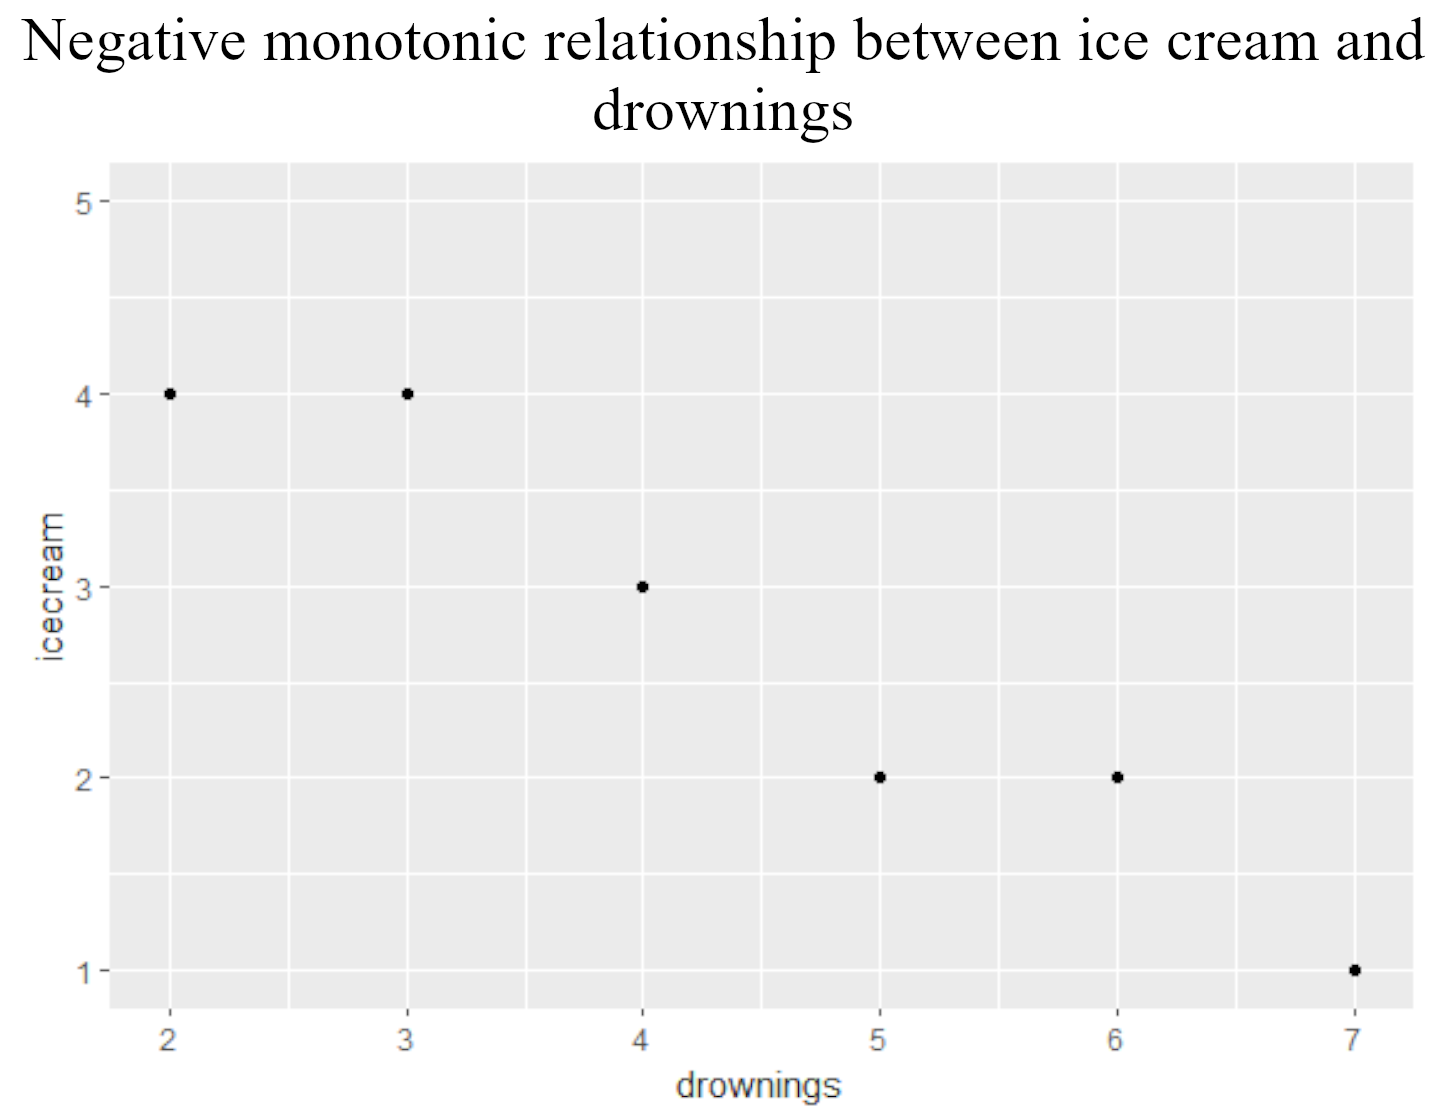
ความสัมพันธ์แบบ Monotonic

  • Spearman correlation (rho) — ความสัมพันธ์แบบ monotonic

    • ไม่จำเป็นต้องเพิ่มหรือลดอย่างสม่ำเสมอ
  • Monotonic มีข้อจำกัดน้อยกว่า linear

ggplot(data, aes(x = drownings, 
                 y = icecream)) +
  geom_point()

กราฟ scatter plot แสดงความสัมพันธ์แบบ monotonically increasing โดยการบริโภคไอศกรีมคงที่ จากนั้นเพิ่มขึ้น แล้วคงที่อีกครั้ง ขณะที่จำนวนการจมน้ำเพิ่มขึ้นบนแกน x

กราฟ scatter plot แสดงความสัมพันธ์แบบ monotonically decreasing โดยการบริโภคไอศกรีมคงที่ จากนั้นลดลง คงที่ แล้วลดลงอีกครั้ง ขณะที่จำนวนการจมน้ำเพิ่มขึ้นบนแกน x

A/B Testing ใน R

สมมติฐานและขนาดกลุ่มตัวอย่าง

  • สมมติฐานหลัก — ไม่มีความสัมพันธ์แบบ monotonic ระหว่างเวลากับความชอบพิซซ่า
library(pwr)
pwr.r.test(r = 0.3, power = 0.80, 
           sig.level = 0.05)
    approximate correlation power 
 calculation (arctangh transformation) 

              n = 84.07364
              r = 0.3
      sig.level = 0.05
          power = 0.8
    alternative = two.sided
A/B Testing ใน R

Spearman แบบไม่แยกกลุ่ม

cor.test(~ enjoyment + time, 
         data = pizza, 
         method = "spearman", 
        exact = FALSE)
    Spearman's rank correlation rho
data:  time and enjoyment
S = 2, p-value = .003245
alternative hypothesis: true rho is 
not equal to 0
sample estimates:
      rho 
0.9984962 
samp <- length(pizza$time)
[1]  90
A/B Testing ใน R

Spearman แบบแยกตามกลุ่ม

cor.test(~ enjoyment + time, 
         data = pizza, 
         subset = 
             (Topping == "Cheese"),
         method = "spearman",
         exact = FALSE)
    Spearman's rank correlation rho
data:  time and enjoyment
S = 1.2434e-14, p-value = 0.0003968
alternative hypothesis: true rho is 
not equal to 0
sample estimates:
rho 
  1 
ggplot(pizza, aes(x = enjoyment, 
                  y = time, 
                  color = Topping)) + 
  geom_point()
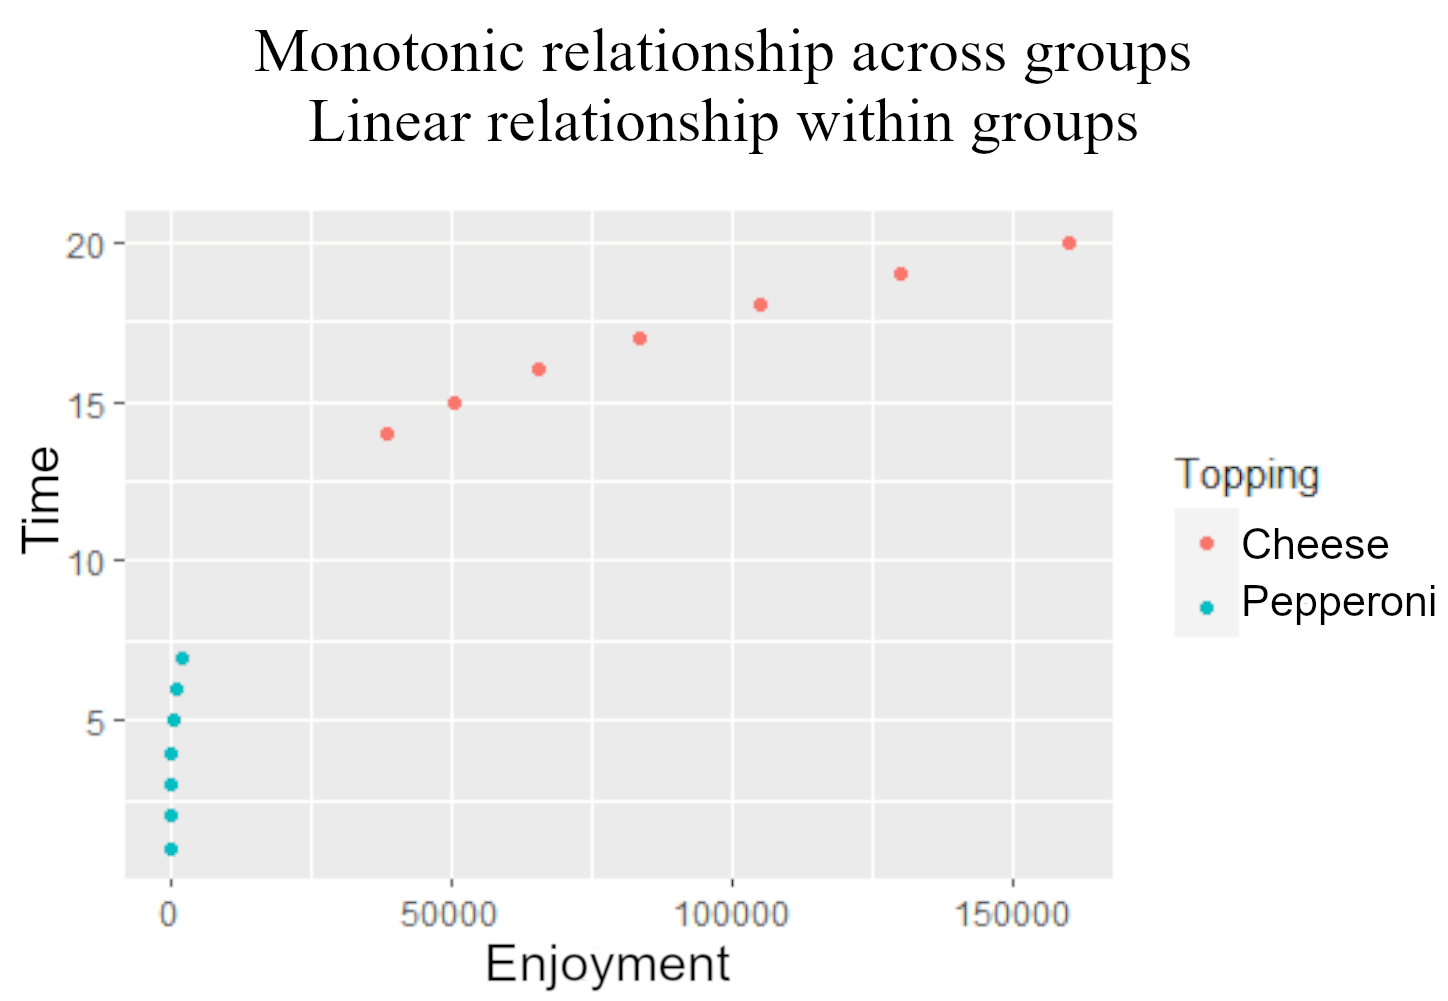
กราฟแสดงข้อมูล Cheese ความชันสูงสีน้ำเงินที่ด้านซ้ายของแกน x และข้อมูล Pepperoni ความชันน้อยกว่าสีชมพูที่ด้านขวาของแกน x

A/B Testing ใน R

การวิเคราะห์ power ของ Spearman

library(pwr)
pwr.r.test(r = 0.998, n = 90, 
           sig.level = 0.003)
     approximate correlation power 
  calculation (arctangh transformation) 

              n = 90
              r = 0.998
      sig.level = 0.003
          power = 1
    alternative = two.sided
A/B Testing ใน R

การอ้างอิงค่าจากผลลัพธ์

rhotest <- cor.test(~ enjoyment + time, 
         data = pizza, 
         method = "spearman")
samp <- length(pizza$time)
library(pwr)
pwr.r.test(r = rhotest$estimate, 
           sig.level = rhotest$p.value,
           n = samp)
     approximate correlation power 
  calculation (arctangh transformation) 

              n = 90
              r = 0.998
      sig.level = 0.003
          power = 1
    alternative = two.sided
A/B Testing ใน R

มาฝึกกันเถอะ!

A/B Testing ใน R

Preparing Video For Download...