Mann-Whitney U test

A/B Testing ใน R

Lauryn Burleigh

Data Scientist

Mann-Whitney U
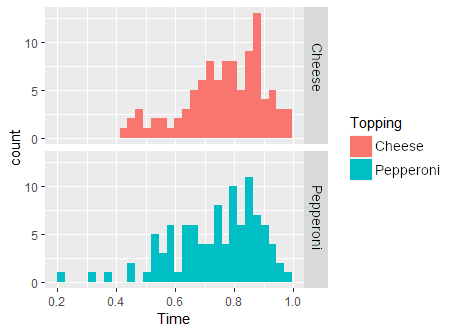
  • เวลาในการกิน pizza ชีสกับเปปเปอโรนี
  • ไม่ใช่การแจกแจงแบบปกติ
  • Non-parametric
    • ไม่สมมติรูปร่างของการแจกแจง
    • Mann-Whitney U test

ฮิสโทแกรมเบ้ซ้าย 2 กราฟ เปปเปอโรนีสีชมพูมีค่าเฉลี่ย 8 และชีสสีน้ำเงินมีค่าเฉลี่ย 6.2

A/B Testing ใน R

สมมติฐาน

  • รูปร่างการแจกแจงเหมือนกัน
  • ประเมินความแตกต่างของค่ามัธยฐาน
  • การแจกแจงปกติ: ค่าเฉลี่ย = มัธยฐาน
  • การแจกแจงไม่ปกติ: มัธยฐานเหมาะสมกว่า
  • สมมติฐานเพิ่มเติม: การทดสอบมีพลังมากขึ้น
  • สมมติฐานว่าง: ไม่มีความแตกต่างของมัธยฐานเวลากิน pizza ชีสและเปปเปอโรนี
library(ggplot2)
ggplot(pizza, aes(x = Time, 
                  fill = Topping)) +
       geom_histogram() + 
       facet_grid(Topping~.)

ฮิสโทแกรมเบ้ซ้าย 2 กราฟ เปปเปอโรนีสีชมพูมีค่าเฉลี่ย 8 และชีสสีน้ำเงินมีค่าเฉลี่ย 6.2

A/B Testing ใน R

ขนาดกลุ่มตัวอย่าง

library(pwr)
pwr.2p2n.test(h = 0.40, 
              sig.level = 0.05, 
              power = 0.8, n1 = 100)
    difference of proportion power 
 calculation for binomial distribution
              h = 0.4
             n1 = 100
             n2 = 96.29156
      sig.level = 0.05
          power = 0.8
    alternative = two.sided
NOTE: different sample sizes
pwr.2p2n.test(h = 0.40, 
              sig.level = 0.05, 
              power = 0.8, n1 = 110)
    difference of proportion power 
 calculation for binomial distribution
              h = 0.4
             n1 = 110
             n2 = 88.54092
      sig.level = 0.05
          power = 0.8
    alternative = two.sided
NOTE: different sample sizes
  • ขนาดเอฟเฟกต์ที่คาดหวัง h: rank-biserial correlation r
    • ดูลำดับของกลุ่มตัวอย่างในแต่ละกลุ่ม
A/B Testing ใน R

การทดสอบ

wilcox.test(Time ~ Topping, 
            data = Pizza)
  • y ~ x
    • y: ข้อมูล
    • x: กลุ่ม
    Wilcoxon rank sum test with 
    continuity correction
data:  Enjoyment by Topping
W = 6051, p-value = 0.01026
alternative hypothesis: true location 
shift is not equal to 0
A/B Testing ใน R

ขนาดเอฟเฟกต์และพลังการทดสอบ

ขนาดเอฟเฟกต์

library(effectsize)
rank_biserial(Time ~ Topping, 
              data = pizza)
r (rank biserial) |         95% CI
<----------------------------------
0.21              | [0.05, 0.36]
  • เล็ก: 0.1
  • กลาง: 0.3
  • ใหญ่: 0.5

1 - 0.14 = 0.86 ความน่าจะเป็นของความผิดพลาด Type II

การวิเคราะห์พลังการทดสอบ

library(pwr)
pwr.2p2n.test(h = 0.21, sig.level = 0.01, 
              n1 = 100, n2 = 100)
     difference of proportion power calculation for binomial distribution 

              h = 0.21
             n1 = 100
             n2 = 100
      sig.level = 0.01
          power = 0.1376818
    alternative = two.sided

NOTE: different sample sizes
A/B Testing ใน R

มาฝึกกันเถอะ!

A/B Testing ใน R

Preparing Video For Download...