การทดสอบ Differential Binding

ChIP-seq with Bioconductor in R

Peter Humburg

Statistician, Macquarie University

การเปรียบเทียบกลุ่มตัวอย่าง ChIP-seq

  • ใช้การวิเคราะห์เชิงสถิติของจำนวน Read เพื่อระบุความแตกต่างที่มีนัยสำคัญระหว่างกลุ่ม
  • แพ็กเกจ DiffBind ให้อินเทอร์เฟซสำหรับเครื่องมือวิเคราะห์
    • ใช้ DESeq2 หรือ edgeR
ChIP-seq with Bioconductor in R

การสร้าง Shared Peak Set

นับ Read ใน Peak Set:

peak_counts <- dba.count(qc_output, summits=250)
ChIP-seq with Bioconductor in R

การกำหนด Contrast

การสร้าง Contrast:

peak_counts <- dba.contrast(peak_counts, categories = DBA_CONDITION)

หมวดหมู่อื่นที่รองรับ:

  • DBA_ID
  • DBA_TISSUE
  • DBA_FACTOR
  • DBA_TREATMENT
  • DBA_REPLICATE
  • DBA_CALLER
ChIP-seq with Bioconductor in R

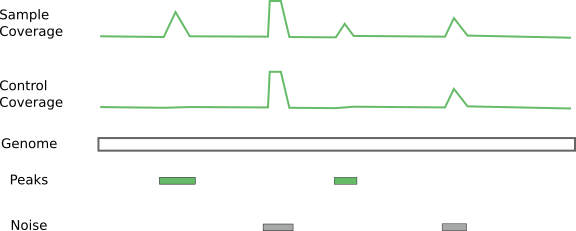
การใช้ Control

ChIP-seq with Bioconductor in R

การรันการวิเคราะห์

bind_diff <- dba.analyze(peak_counts)
ChIP-seq with Bioconductor in R

ดูผลลัพธ์เบื้องต้น

PCA Plot สำหรับ Peak ที่มี Differential Binding

dba.plotPCA(bind_diff, DBA_Condition, contrast=1)

Heatmap สำหรับ Peak ที่มี Differential Binding

dba.plotHeatmap(bind_diff, DBA_Condition, contrast=1)
ChIP-seq with Bioconductor in R

มาฝึกกันเถอะ!

ChIP-seq with Bioconductor in R

Preparing Video For Download...