บทนำและแรงจูงใจ
การตรวจจับการฉ้อโกงใน R

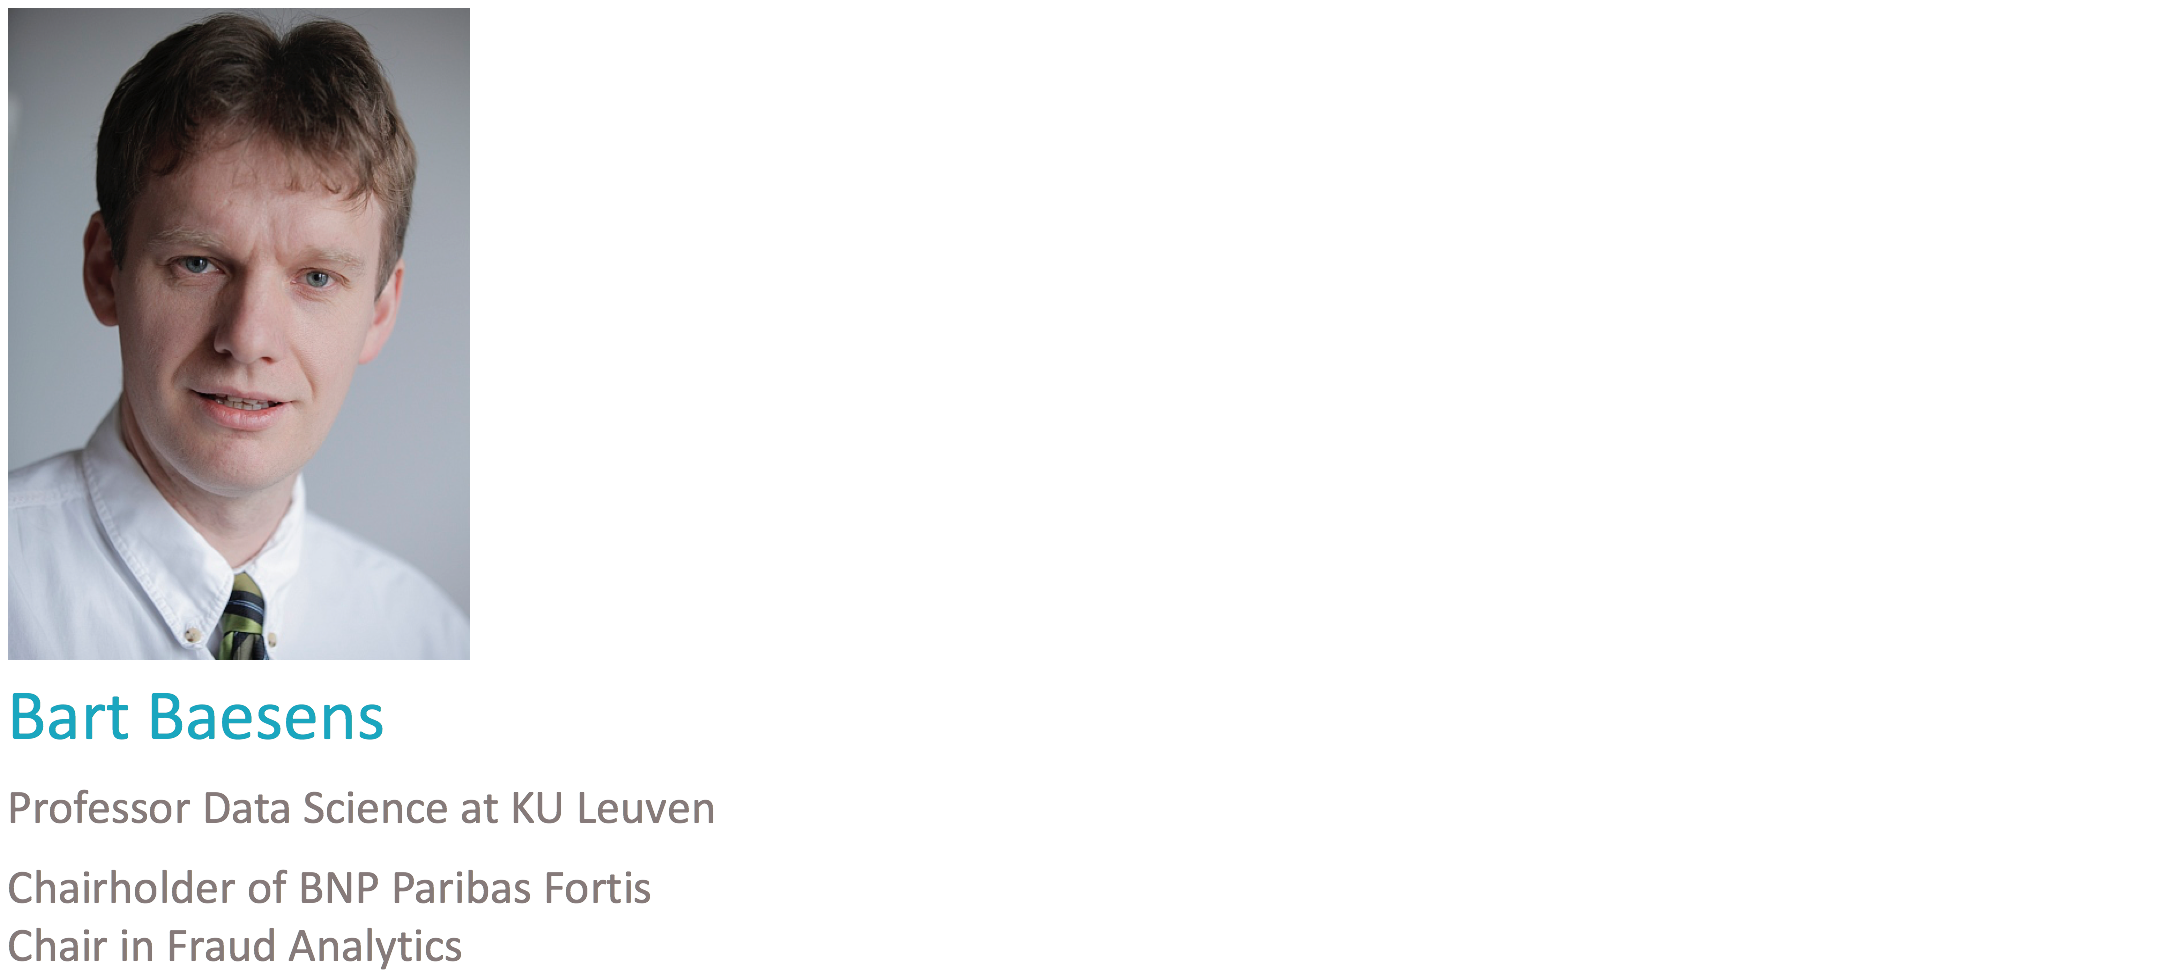
Bart Baesens
Professor Data Science at KU Leuven
ผู้สอน
ผู้สอน

ผู้สอน

การฉ้อโกงคืออะไร?
การฉ้อโกงเป็นอาชญากรรมที่เกิดขึ้นน้อย วางแผนมาอย่างดี ซ่อนเร้นแนบเนียน เปลี่ยนแปลงตามเวลา และมักถูกจัดการอย่างเป็นระบบ โดยปรากฏในรูปแบบที่หลากหลาย

คุณสมบัติหลักของโมเดลวิเคราะห์การฉ้อโกงที่ประสบความสำเร็จ

คุณสมบัติหลักของโมเดลวิเคราะห์การฉ้อโกงที่ประสบความสำเร็จ

คุณสมบัติหลักของโมเดลวิเคราะห์การฉ้อโกงที่ประสบความสำเร็จ

คุณสมบัติหลักของโมเดลวิเคราะห์การฉ้อโกงที่ประสบความสำเร็จ

คุณสมบัติหลักของโมเดลวิเคราะห์การฉ้อโกงที่ประสบความสำเร็จ

ความท้าทายของโมเดลตรวจจับการฉ้อโกง
ความท้าทายของโมเดลตรวจจับการฉ้อโกง

ความท้าทายของโมเดลตรวจจับการฉ้อโกง

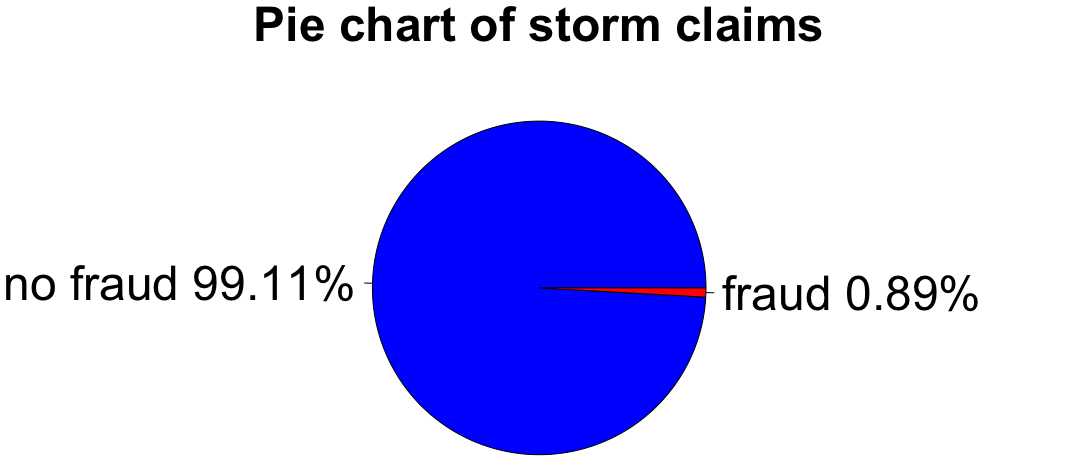
แสดงความไม่สมดุลด้วยแผนภูมิวงกลม
labels <- c("no fraud", "fraud")
labels <- paste(labels, round(100 * prop.table(table(fraud_label)), 2), "%")
pie(table(fraud_label), labels, col = c("blue", "red"),
      main = "Pie chart of storm claims")
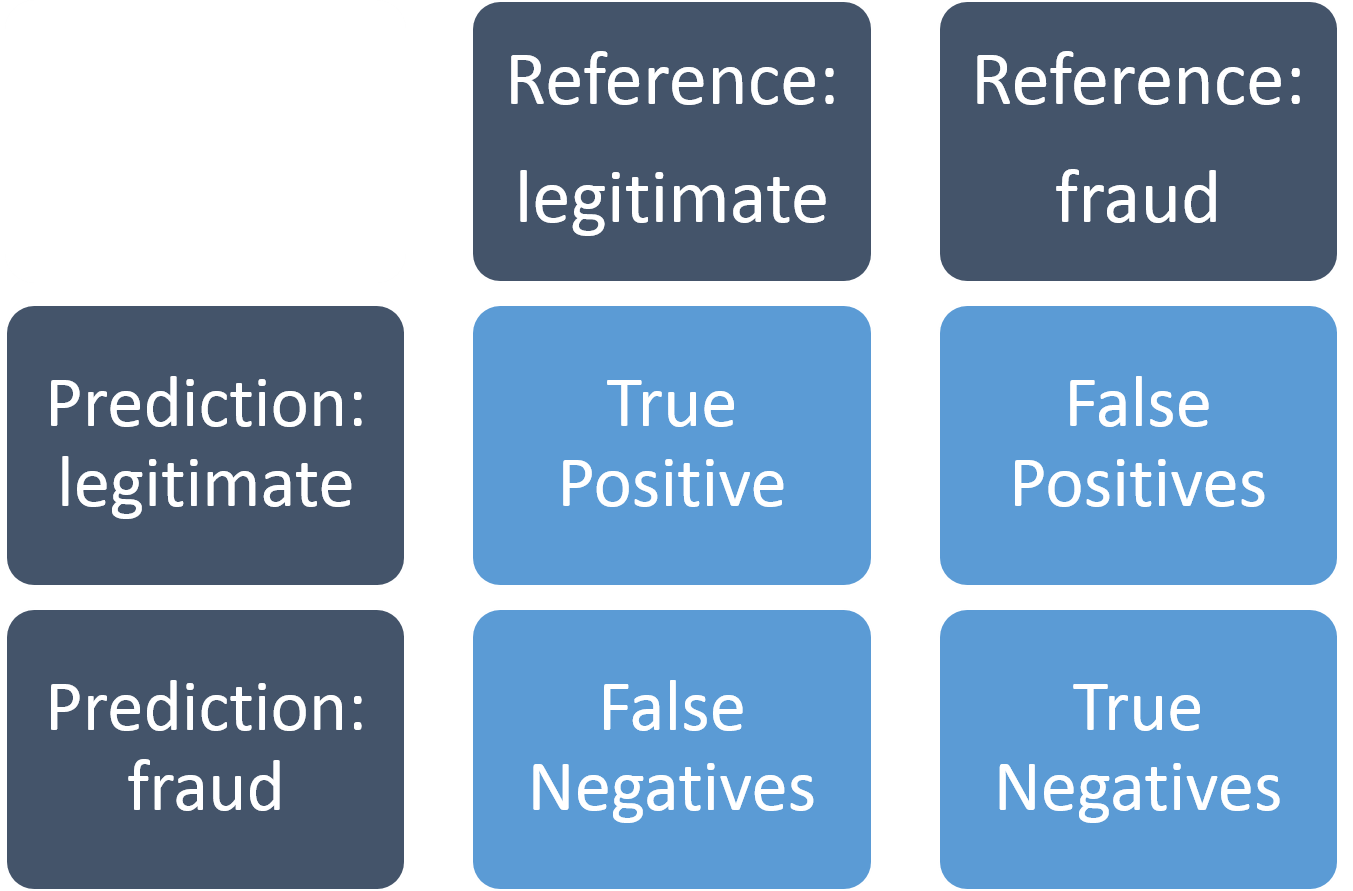
Confusion matrix
ใช้สำหรับประเมินโมเดลตรวจจับการฉ้อโกง: