Linear regressions and pairs bootstrap
กรณีศึกษาด้านการคิดเชิงสถิติ

Justin Bois
Lecturer, Caltech
Bacterial growth
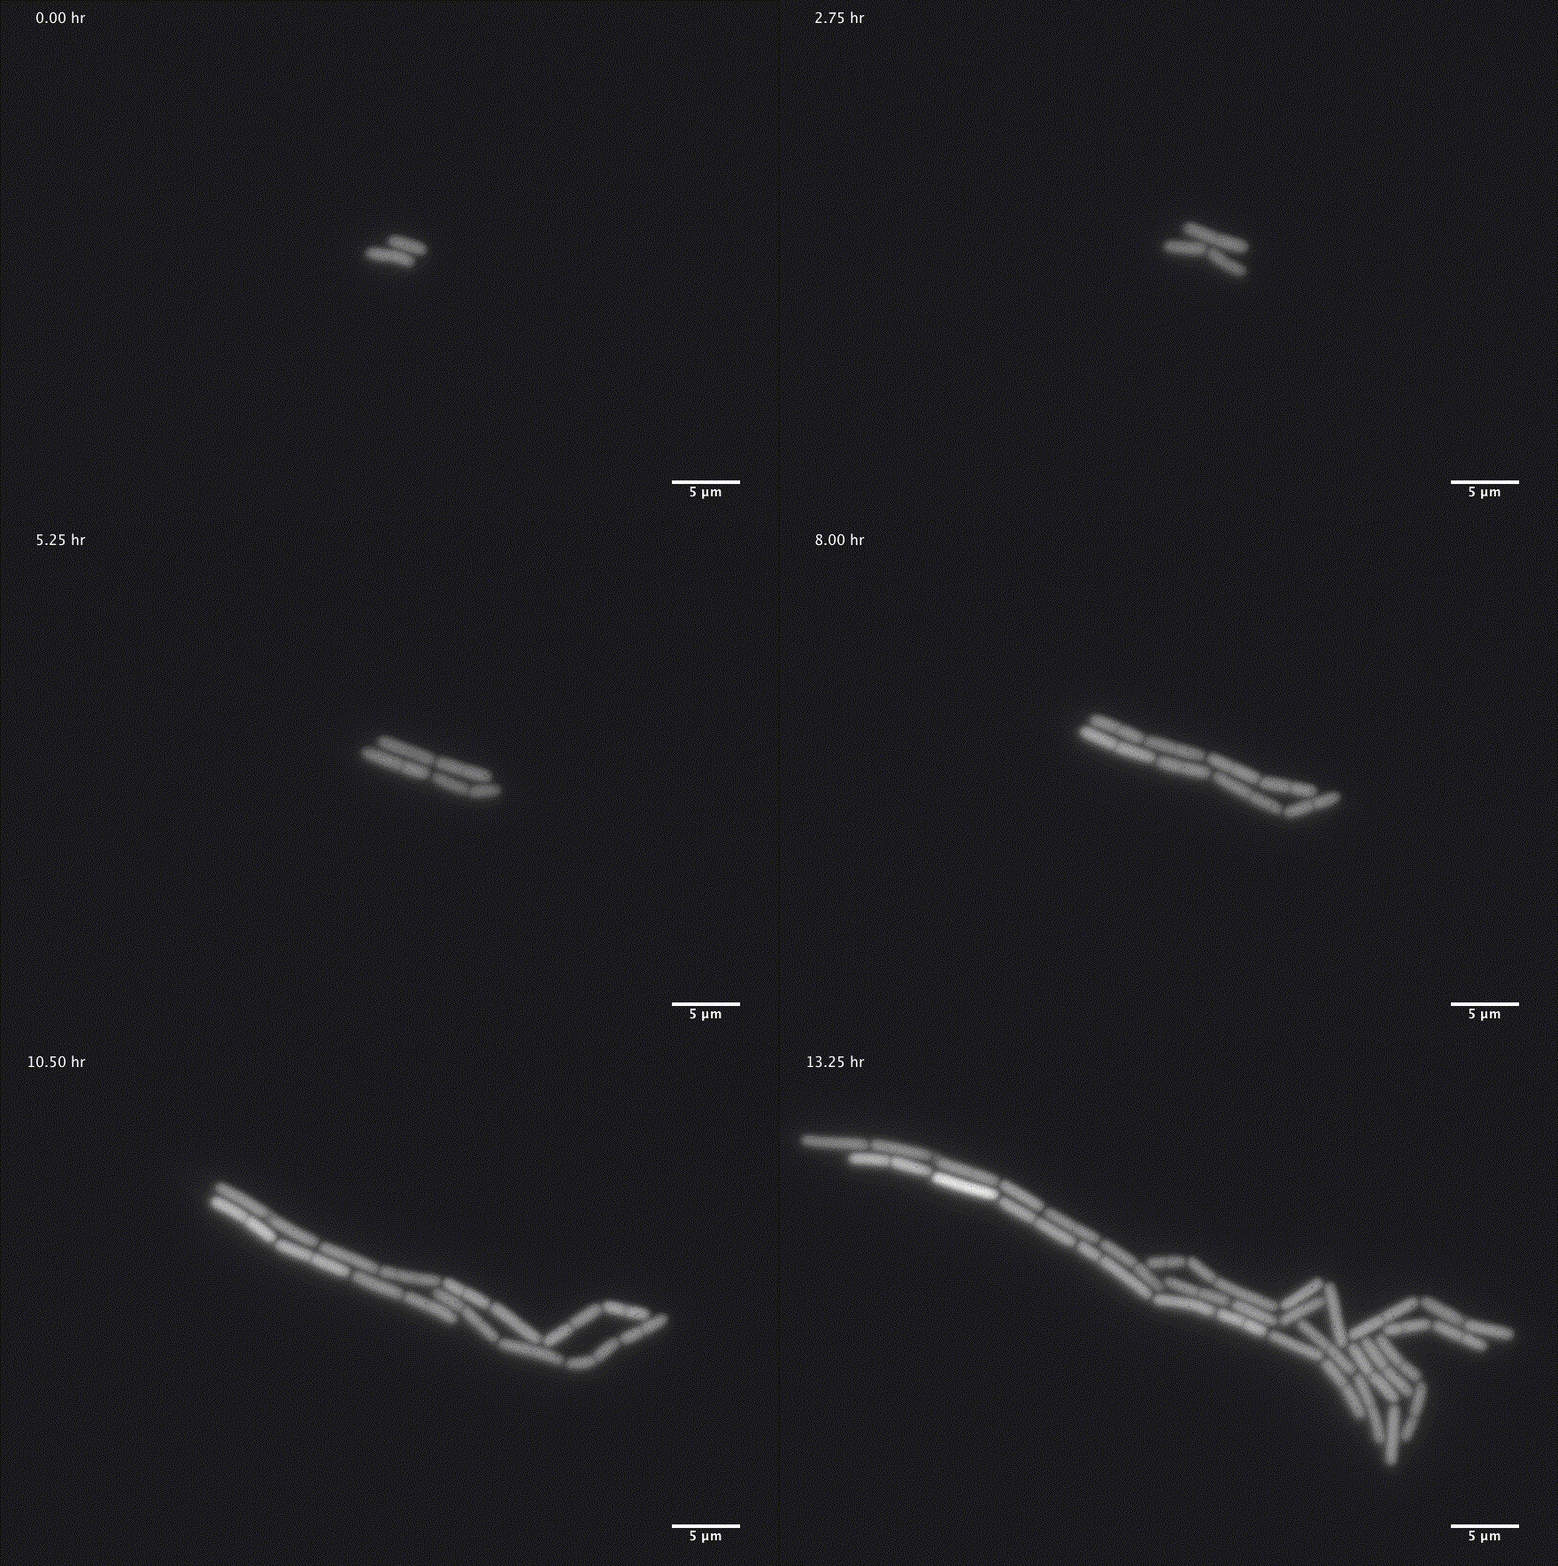
1 ภาพโดย Jin Park และ Michael Elowitz, Caltech
การเจริญเติบโตของแบคทีเรีย
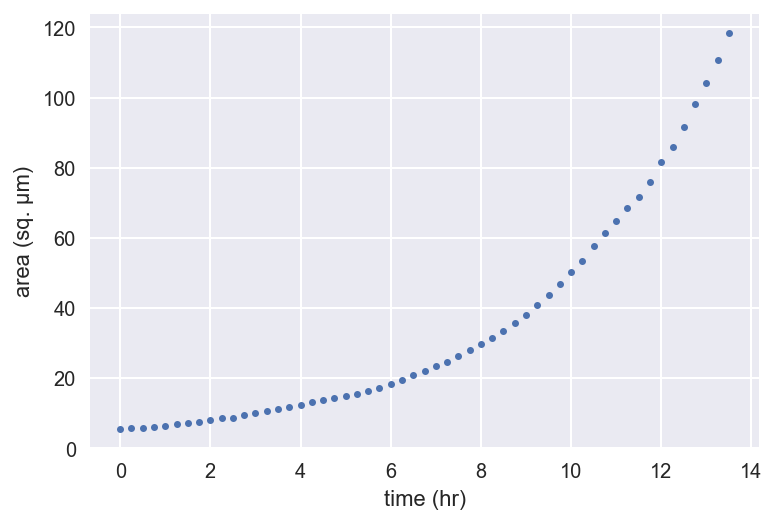
_ = plt.semilogy(t, bac_area, marker='.', linestyle='none')
_ = plt.xlabel('time (hr)')
_ = plt.ylabel('area (sq. µm)')
plt.show()

Linear regression ด้วย np.polyfit()
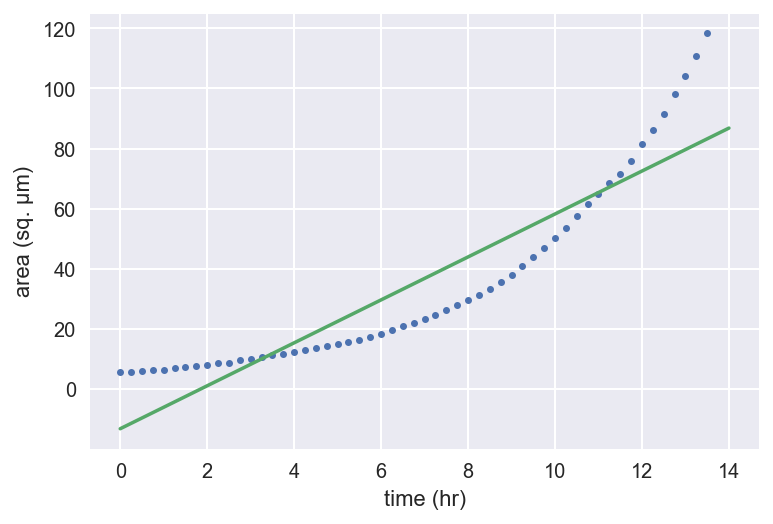
slope, intercept = np.polyfit(t, bac_area, 1)
t_theor = np.array([0, 14])
bac_area_theor = slope * t_theor + intercept
_ = plt.plot(t, bac_area, marker='.', linestyle='none')
_ = plt.plot(t_theor, bac_area_theor)
_ = plt.xlabel('time (hr)')
_ = plt.ylabel('area (sq. µm)')
plt.show()
การถดถอยของการเจริญเติบโตแบคทีเรีย
Semilog-linear regression ด้วย np.polyfit()
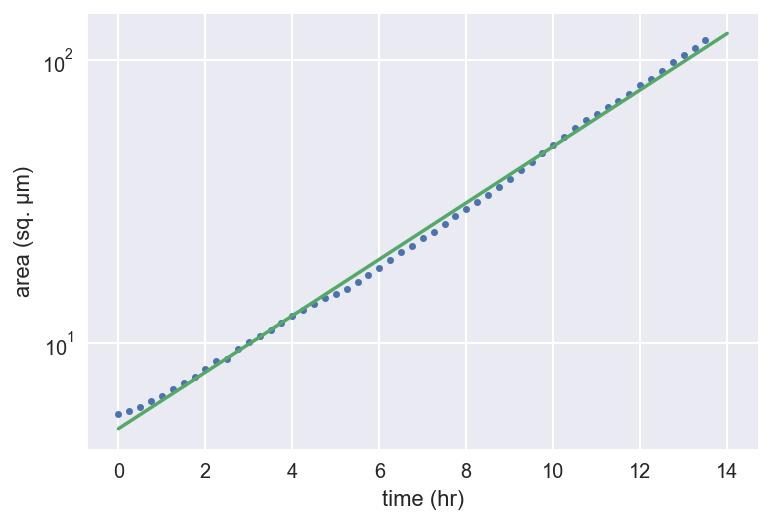
slope, intercept = np.polyfit(t, np.log(bac_area), 1)
t_theor = np.array([0, 14])
bac_area_theor = np.exp(slope * t_theor + intercept)
_ = plt.semilogy(t, bac_area, marker='.', linestyle='none')
_ = plt.semilogy(t_theor, bac_area_theor)
_ = plt.xlabel('time (hr)')
_ = plt.ylabel('area (sq. µm)')
plt.show()
การถดถอยของการเจริญเติบโตแบคทีเรีย
Pairs bootstrap
- สุ่มตัวอย่างข้อมูลเป็นคู่
- คำนวณ slope และ intercept จากข้อมูลที่สุ่ม
- แต่ละ slope และ intercept คือ bootstrap replicate
- คำนวณช่วงความเชื่อมั่นจาก percentile ของ bootstrap replicates
Pairs bootstrap
# Draw 10000 pairs bootstrap reps slope_reps, int_reps = dcst.draw_bs_pairs_linreg( x_data, y_data, size=10000 )# Compute 95% confidence interval of slope slope_conf_int = np.percentile(slope_reps, [2.5, 97.5])

