Створіть набір даних для ілюстрації ключових принципів SVM.
У наборі два змінні та лінійна межа рішення.
Генерація двовимірного набору даних за допомогою runif()
Згенеруйте набір із двох змінних на 200 точок
Змінні x1 і x2 рівномірно розподілені в (0,1).
# Preliminaries...
# Set required number of data points
n <- 200
# Set seed to ensure reproducibility
set.seed(42)

# Generate dataframe with two predictors x1 and x2 in (0,1)
df <- data.frame(x1 = runif(n),
                 x2 = runif(n))
Створення двох класів
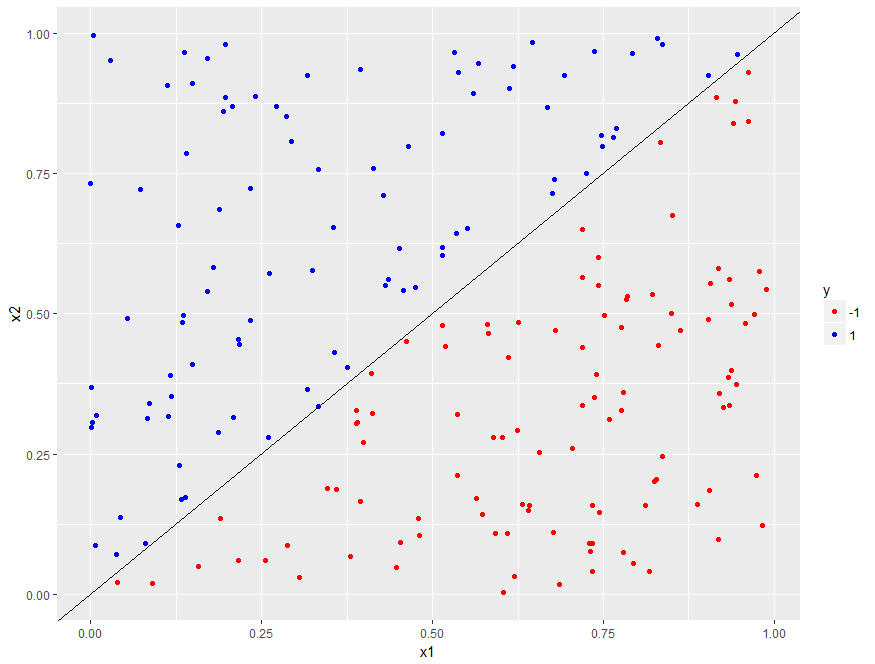
Створіть два класи, розділені прямою межею рішення x1 = x2
Пряма проходить через (0, 0) та утворює кут 45° з віссю x
Змінна класу y = -1 для точок нижче прямої та y = 1 для точок вище
# Classify points as -1 or +1
df$y <- factor(ifelse(df$x1 - df$x2 > 0, -1, 1),
               levels = c(-1, 1))
Візуалізація набору даних за допомогою ggplot
Створіть двовимірну діаграму розсіювання: x1 по осі x, x2 по осі y
Відрізняйте класи кольором (нижче лінії = червоний; вище = синій)
Межа рішення — лінія x1 = x2: проходить через (0, 0), кутовий коефіцієнт = 1
library(ggplot2)

# Build plot
p <- ggplot(data = df, aes(x = x1, y = x2, color = y)) +
     geom_point() +
     scale_color_manual(values = c("-1" = "red", "1" = "blue")) +
     geom_abline(slope = 1, intercept = 0)

# Display it
p
Додаємо відступ (margin)
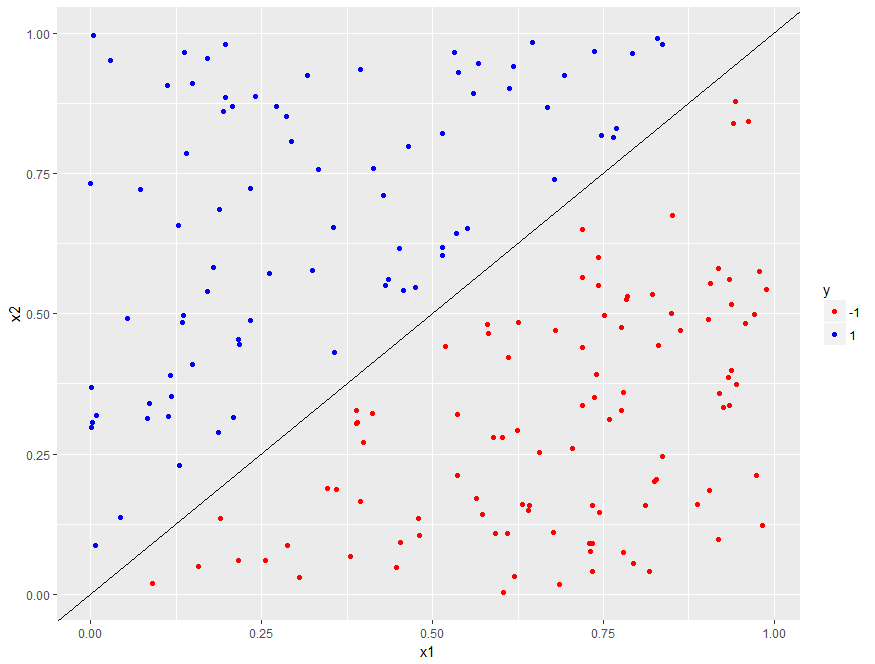
Щоб створити відступ (margin), потрібно прибрати точки, близькі до межі
Приберіть точки, у яких значення x1 і x2 відрізняються менш ніж на задану величину
# Create a margin of 0.05 in dataset
delta <- 0.05
# Retain only those points that lie outside the margin
df1 <- df[abs(df$x1 - df$x2) > delta, ]
# Check number of data points remaining
nrow(df1)

# Replot dataset with margin (code is exactly same as before)
p <- ggplot(data = df1, aes(x = x1, y = x2, color = y)) +
     geom_point() +
     scale_color_manual(values = c("red", "blue")) +
     geom_abline(slope = 1, intercept = 0)
# Display plot
p
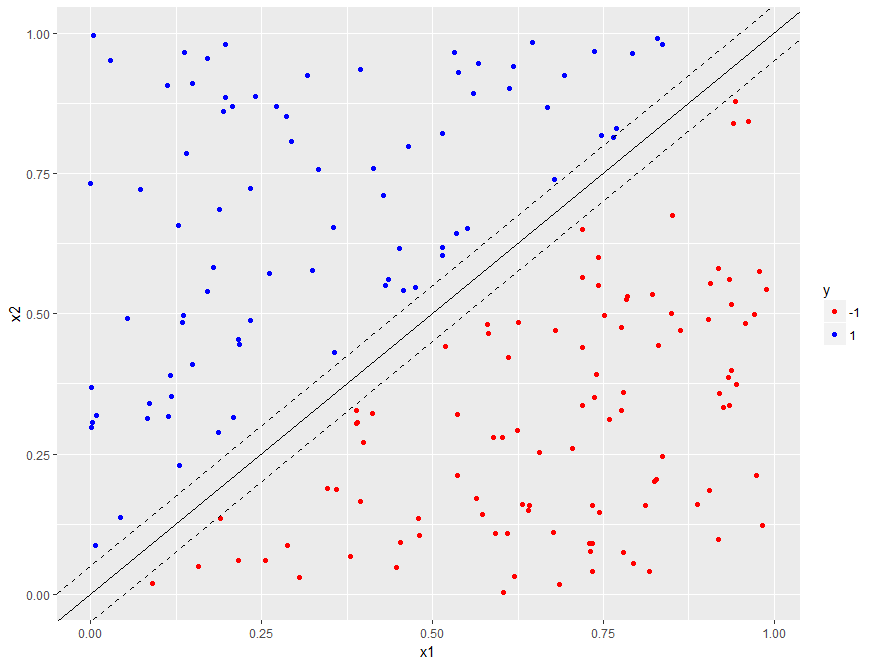
Побудова меж відступу
Межі відступу:
паралельні межі рішення (кутовий коефіцієнт = 1).
розміщені на delta одиниць з обох боків (delta = 0,05).
p <- p +
     geom_abline(slope = 1, intercept = delta, linetype = "dashed") +
     geom_abline(slope = 1, intercept = -delta, linetype = "dashed")

p