การวิเคราะห์การถดถอย

การวิเคราะห์ข้อมูลแบบสำรวจด้วย Python

EbunOluwa Andrew

Data Scientist

การวิเคราะห์การถดถอย

  • ทำความเข้าใจความสัมพันธ์ระหว่างตัวแปร
  • ใช้ทำนายผลลัพธ์ที่แม่นยำ
  • วัดอิทธิพลของตัวแปรอิสระต่างๆ ที่มีต่อตัวแปรตาม
  • คาดการณ์โอกาสและความเสี่ยงในอนาคต
  • แปลงข้อมูลดิบจำนวนมากให้เป็นข้อมูลที่นำไปใช้ได้
  • ให้ข้อมูลเชิงประจักษ์สนับสนุนการตัดสินใจ

ผู้คนพยายามรับมือกับแผนภูมิการเงินที่ลดลง

การวิเคราะห์ข้อมูลแบบสำรวจด้วย Python

Linear regression ด้วยวิธี Ordinary Least Squares (OLS)

  • โมเดล Linear regression
    • สมมติว่ามีความสัมพันธ์เชิงเส้นระหว่างตัวแปร x และ y
    • y = m * x + b
    • วิธี Ordinary Least Squares (OLS)
    • Sum((calculated-observed)^2) => minimized

https://seeing-theory.brown.edu/regression-analysis/index.html

1 https://seeing-theory.brown.edu/regression-analysis/index.html
การวิเคราะห์ข้อมูลแบบสำรวจด้วย Python

โหลดข้อมูล

import pandas as pd

import numpy as np
import matplotlib.pyplot as plt
import statsmodels.api as sm
exercise_data = pd.read_csv('workout_survey_data.csv') print(exercise_data.head())
| workout_minutes | calories_burned |
|-----------------|-----------------|
| 77              | 79.775152       |
| 21              | 23.177279       |
| 22              | 25.609262       |
| 20              | 17.857388       |
การวิเคราะห์ข้อมูลแบบสำรวจด้วย Python

กำหนดตัวแปร

x = ตัวแปรอิสระ y = ตัวแปรตาม

x = exercise_data.minutes.tolist()
y = exercise_data.calories.tolist() 
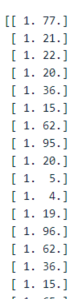
print(x,'\n',y)
| [77, 21, 22, 20, 36...           |
|----------------------------------|
| [79.7, 23.1, 25.6, 17.8, 41.8... |

ข้อมูลแบบสำรวจ

workout_minutes calories_burned
77 79.775152
21 23.177279
22 25.609262
20 17.857388
36 41.849864
การวิเคราะห์ข้อมูลแบบสำรวจด้วย Python

เพิ่มค่าคงที่

x = sm.add_constant(x)
print (x)
  • บอกให้โมเดลคำนวณค่า b

การวิเคราะห์ข้อมูลแบบสำรวจด้วย Python

ทำการถดถอยและ fit โมเดล

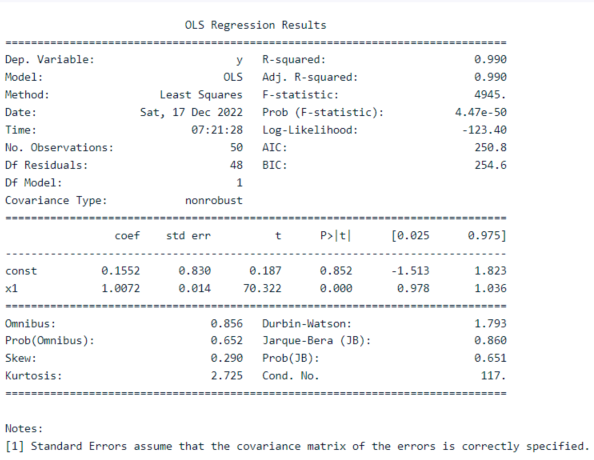
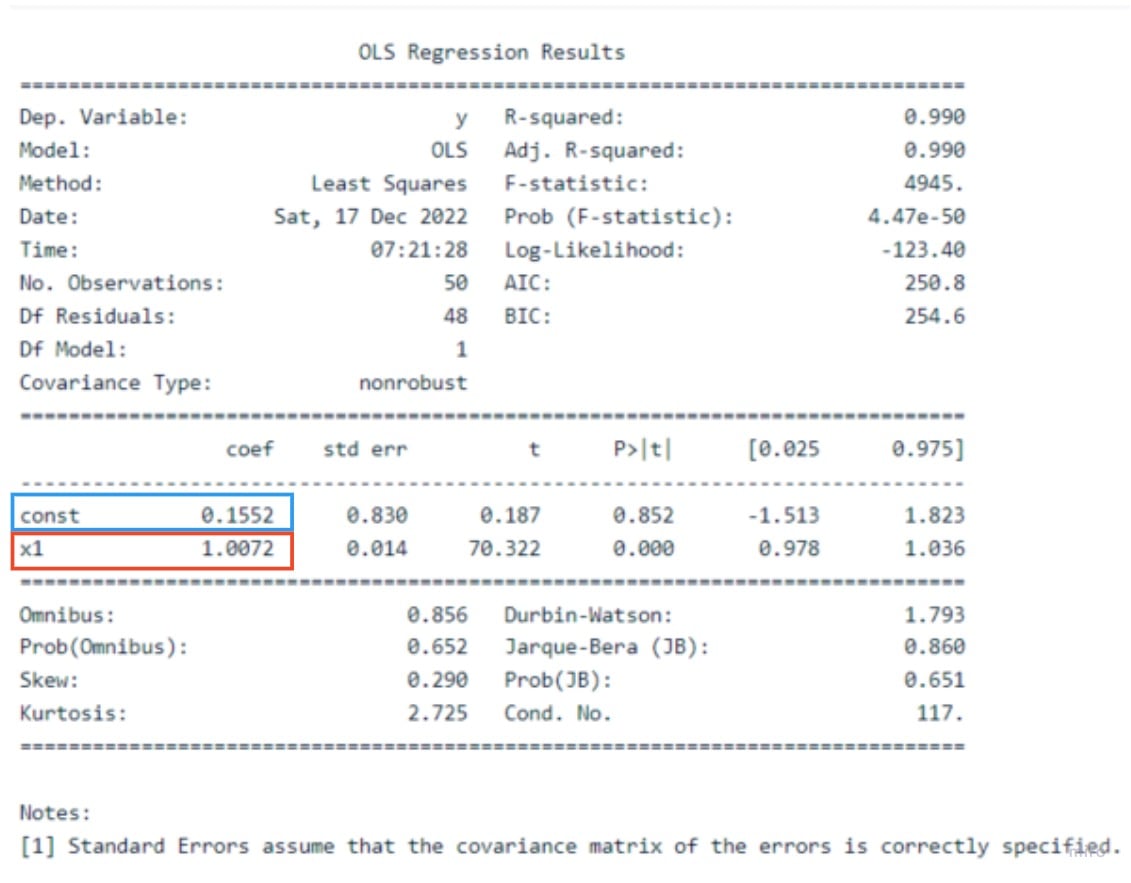
result = sm.OLS(y,x).fit()
print(result.summary())

การวิเคราะห์ข้อมูลแบบสำรวจด้วย Python

ดึงค่า m และ b

การวิเคราะห์ข้อมูลแบบสำรวจด้วย Python

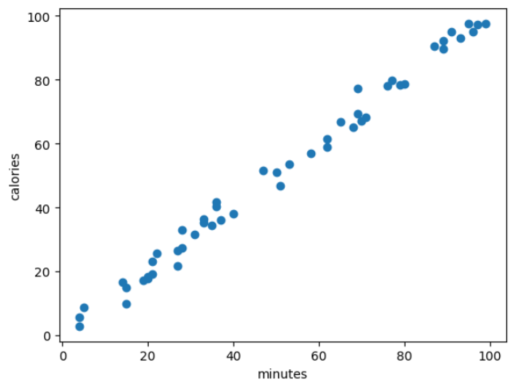
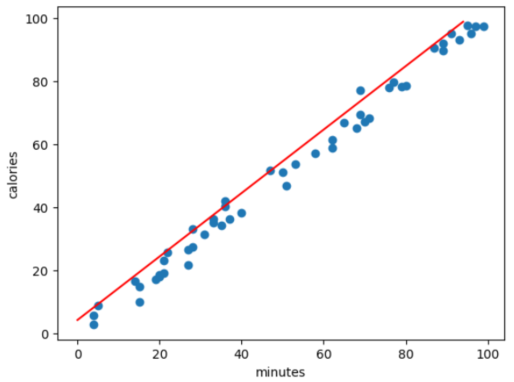
พล็อตค่าข้อมูลต้นฉบับ

x = exercise_data.minutes.tolist()
y = exercise_data.calories.tolist()
plt.scatter(x,y)
plt.xlabel('minutes')
plt.ylabel('calories')
plt.show()

การวิเคราะห์ข้อมูลแบบสำรวจด้วย Python

พล็อตเส้น regression

max_x = exercise_data.minutes.max()
min_x = exercise_data.minutes.min()
x = np.arange(min_x, max_x, 1)

y = 1.0072*x + 0.1552
plt.plot(y, 'r') plt.show()

การวิเคราะห์ข้อมูลแบบสำรวจด้วย Python

ทำนายค่าผลลัพธ์

y = 1.0072 * 30 + 0.1552
print(y)
30.3712
การวิเคราะห์ข้อมูลแบบสำรวจด้วย Python

ข้อดีและข้อเสียของ Linear regression

  • ข้อดี
    • ทำงานได้ดีเมื่อข้อมูลแยกกันได้เชิงเส้น
  • ข้อเสีย
    • สมมติความสัมพันธ์เชิงเส้น ซึ่งไม่เหมาะกับข้อมูลที่ไม่เป็นเชิงเส้น

การวิเคราะห์ข้อมูลแบบสำรวจด้วย Python

มาฝึกกันเถอะ!

การวิเคราะห์ข้อมูลแบบสำรวจด้วย Python

Preparing Video For Download...