การสุ่มตัวอย่างแบบมีน้ำหนัก

การวิเคราะห์ข้อมูลแบบสำรวจด้วย Python

EbunOluwa Andrew

Data Scientist

การสุ่มตัวอย่างแบบมีน้ำหนักคืออะไร?

  • ความน่าจะเป็นที่ไม่เท่ากัน
  • ช่วยให้นักวิจัยแก้ไขปัญหาที่เกิดขึ้นระหว่างการเก็บข้อมูลได้

ตราชั่งยุติธรรมบนโต๊ะ

การวิเคราะห์ข้อมูลแบบสำรวจด้วย Python

ตัวแปรที่ใช้บ่อยในการสุ่มตัวอย่างแบบมีน้ำหนัก

  • ลักษณะประชากร เช่น เพศ อายุ ที่อยู่ และการศึกษา
  • ชดเชยความแตกต่างระหว่างผู้ที่เข้าร่วมและไม่เข้าร่วมงานวิจัย
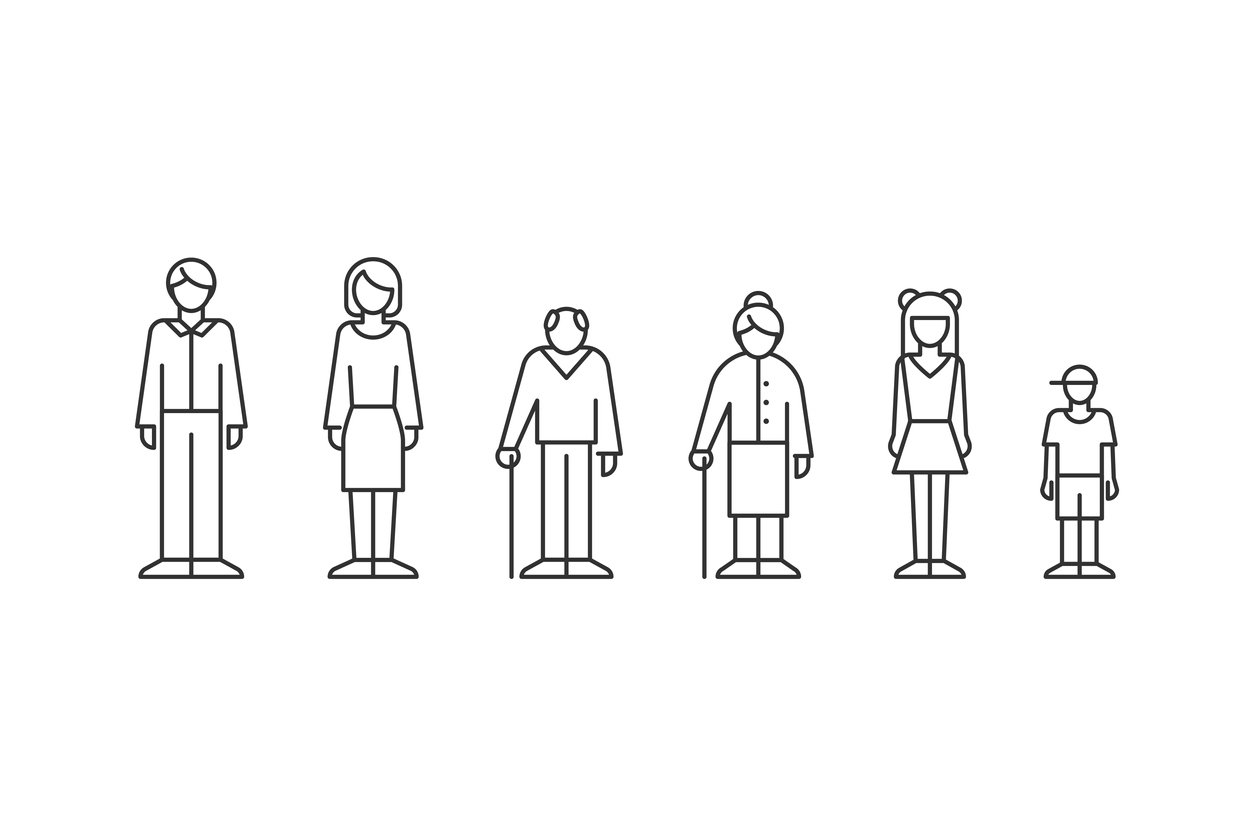
โครงร่างครอบครัวและผู้คนต่างช่วงวัย

การวิเคราะห์ข้อมูลแบบสำรวจด้วย Python

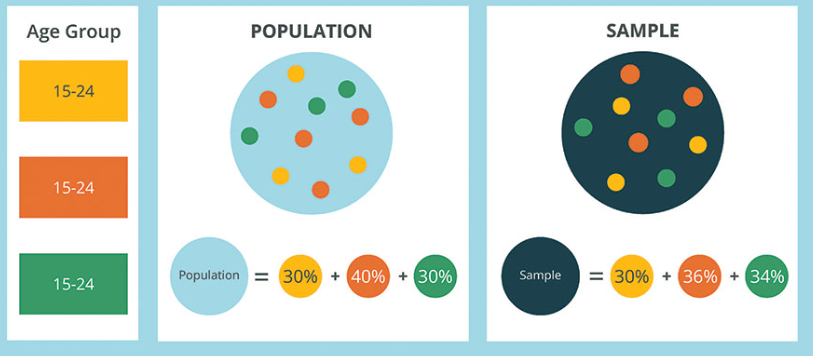
การถ่วงน้ำหนักแบบเซลล์

1 https://www.geopoll.com/blog/weighting-survey-data-raking-cell-weighting/
การวิเคราะห์ข้อมูลแบบสำรวจด้วย Python

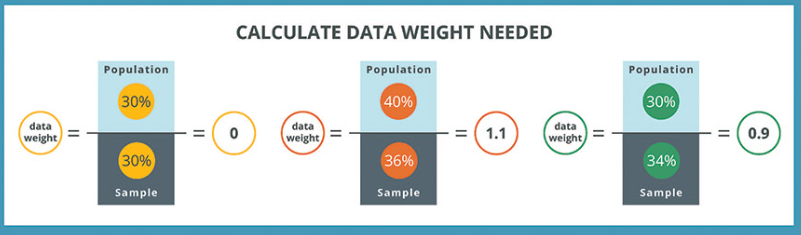
การถ่วงน้ำหนักแบบเซลล์

1 https://www.geopoll.com/blog/weighting-survey-data-raking-cell-weighting/
การวิเคราะห์ข้อมูลแบบสำรวจด้วย Python

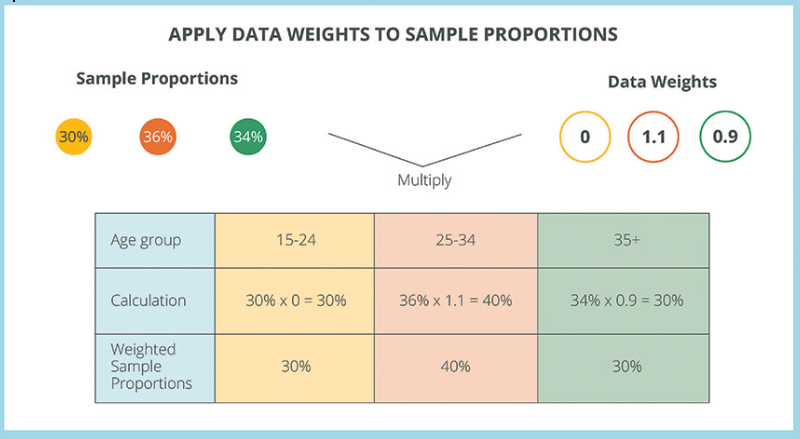
การถ่วงน้ำหนักแบบเซลล์

1 https://www.geopoll.com/blog/weighting-survey-data-raking-cell-weighting/
การวิเคราะห์ข้อมูลแบบสำรวจด้วย Python

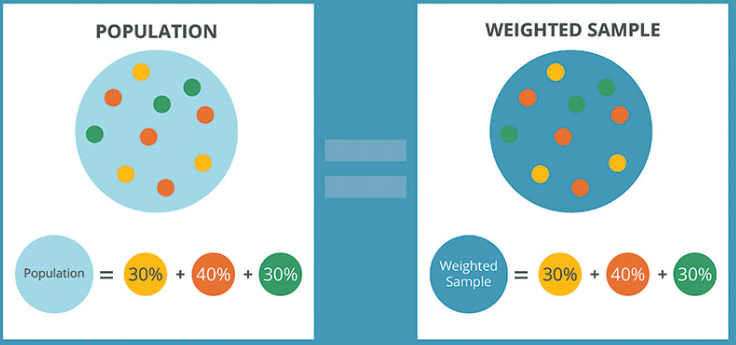
การถ่วงน้ำหนักแบบเซลล์

1 https://www.geopoll.com/blog/weighting-survey-data-raking-cell-weighting/
การวิเคราะห์ข้อมูลแบบสำรวจด้วย Python

วิเคราะห์พฤติกรรมการใช้จ่ายของเยาวชนด้วย Python
yp_survey
| Gender | Age | Entertainment |
|--------|-----|---------------|
| female |  19 | Agree         |
| female |  20 | Agree         |
| male   |  19 | Agree         |
| female |  19 | Disagree      |
| female |  24 | Disagree      |
| male   |  18 | Agree         |
| male   |  18 | Agree         |
| male   |  20 | Disagree      |
การวิเคราะห์ข้อมูลแบบสำรวจด้วย Python

วิเคราะห์พฤติกรรมการใช้จ่ายของเยาวชนด้วย Python
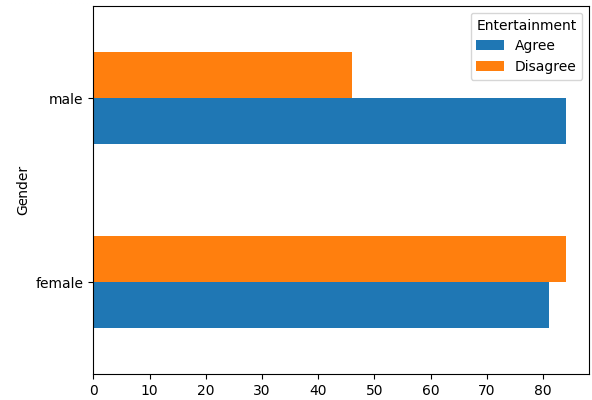
import pandas as pd
yp_crosstab = pd.crosstab(
  yp_survey['Gender'],
  yp_survey['Entertainment'])
yp_crosstab
yp_crosstab.plot.barh()
|        | Agree | Disagree |
|--------|-------|----------|
| female |    81 |       84 |
| male   |    84 |       46 |

การวิเคราะห์ข้อมูลแบบสำรวจด้วย Python

วิเคราะห์พฤติกรรมการใช้จ่ายของเยาวชนด้วย Python

survey = yp_survey.groupby(['Gender', 'Entertainment'])['Age'].count().reset_index()

survey.columns = ['Gender', 'Entertainment', 'Respondents'] survey
| Gender | Entertainment | Respondents |
|--------|---------------|-------------|
| female | Agree         |          81 |
| female | Disagree      |          84 |
| male   | Agree         |          84 |
| male   | Disagree      |          46 |
การวิเคราะห์ข้อมูลแบบสำรวจด้วย Python

วิเคราะห์พฤติกรรมการใช้จ่ายของเยาวชนด้วย Python

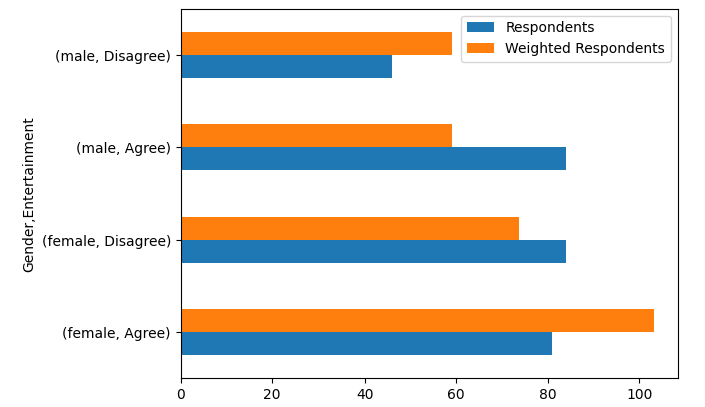
survey['% total respondents'] = survey.Respondents * 100./survey.Respondents.sum()
survey['% of population'] = [35, 25, 20, 20]
survey['Weight'] = survey['% of population']/survey['% total respondents']
survey['Weighted Respondents'] = survey.Weight * survey.Respondents
การวิเคราะห์ข้อมูลแบบสำรวจด้วย Python

วิเคราะห์พฤติกรรมการใช้จ่ายของเยาวชนด้วย Python

survey[['Gender','Entertainment',
        'Respondents','Weighted Respondents']].set_index(
  ['Gender','Entertainment']).plot.barh()

การวิเคราะห์ข้อมูลแบบสำรวจด้วย Python

มาฝึกกันเถอะ!

การวิเคราะห์ข้อมูลแบบสำรวจด้วย Python

Preparing Video For Download...