Feature engineering คืออะไร?

Feature Engineering in R

Jorge Zazueta

Research Professor and Head of the Modeling Group at the School of Economics, UASLP

Feature engineering คืออะไร?

Feature engineering คือศาสตร์และศิลป์ของการ

  • สร้าง,
  • แปลง,
  • ดึง และ
  • คัดเลือก

ตัวแปร เพื่อเพิ่มประสิทธิภาพและความสามารถในการตีความโมเดล

ความสูงของวัตถุในฟังก์ชันของเวลา

# A tibble: 100 × 2
    time height
   <dbl>  <dbl>
 1 0       0   
 2 0.101   3.85
 3 0.202  17.7 
 4 0.303  15.1 
 5 0.404  20.0 
 6 0.505  32.6 
 7 0.606  30.8 
 8 0.707  26.6 
 9 0.808  33.8 
10 0.909  39.2 
# ... with 90 more rows
# ℹ Use `print(n = ...)` to see more rows
Feature Engineering in R

ทำไมต้อง engineer features?

สร้างโมเดล regression อย่างง่ายสำหรับความสูง

lr_height <- lm(height ~ time,
                data = height)

จากนั้นพล็อตกราฟเพื่อประเมินความแม่นยำเบื้องต้น

df <- height %>% 
bind_cols(lr_pred = predict(lr_height))

df %>%
  ggplot(aes(x = time, y = height)) +
  geom_point() +
  geom_line(aes(y = lr_pred), 
            color = "blue", lwd = .75)+
    theme_classic()

โมเดลนี้ไม่สามารถแทนข้อมูลได้เลย!

Linear regression ของความสูง เทียบกับ เวลา
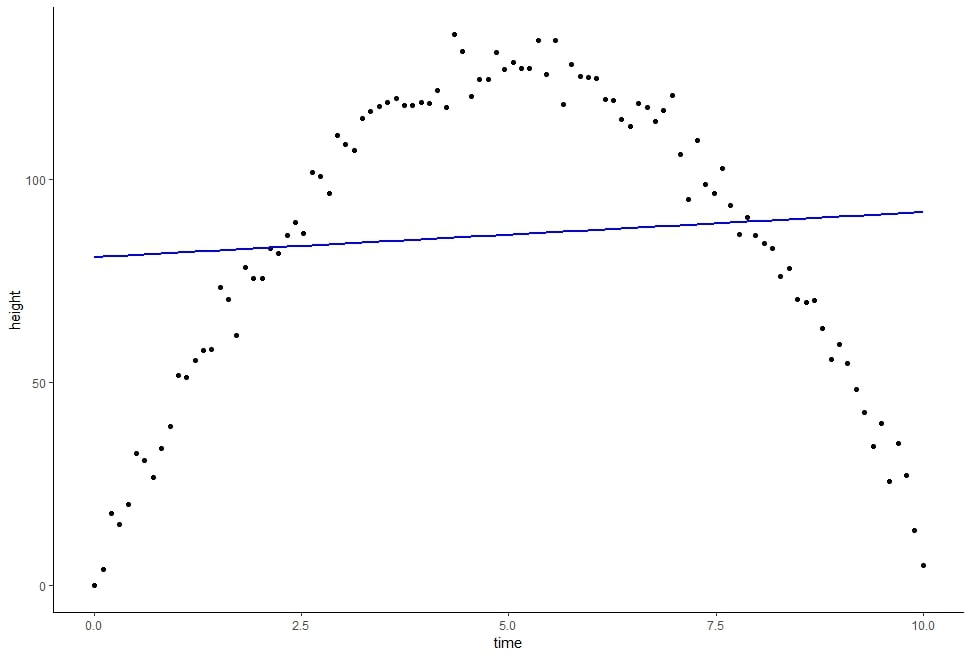
Linear regression ของความสูงเทียบกับเวลา แสดงให้เห็นว่าโมเดลไม่ fit กับข้อมูล

Feature Engineering in R

การใช้ mutate()

ความสูงของวัตถุเป็นไปตามเส้นโค้งพาราโบลา ซึ่งแสดงด้วยสูตรต่อไปนี้:

$y(t) = y_0 + v_0t - \frac{g}{2}t^2$.

โดย $y$ คือความสูงของวัตถุ ณ เวลา $t$ และ $y_0$, $v_0$, และ $g$ คือความสูงเริ่มต้น ความเร็วต้น และความเร่งเนื่องจากแรงโน้มถ่วงตามลำดับ

สามารถ fit โมเดลได้โดยคำนึงถึงการที่ความสูงขึ้นอยู่กับทั้งเวลาและกำลังสองของเวลา

mutate() รับ data frame เป็นอาร์กิวเมนต์แรก และนิยามของตัวแปรใหม่ที่จะเพิ่มเข้าไปใน data frame

df_2 <- df %>% mutate(time_2 = time^2)
# A tibble: 100 × 4
    time height lr_pred time_2
   <dbl>  <dbl>   <dbl>  <dbl>
 1 0       0       80.8 0     
 2 0.101   3.85    80.9 0.0102
 3 0.202  17.7     81.0 0.0408
 4 0.303  15.1     81.1 0.0918
Feature Engineering in R

พยากรณ์โดยใช้ engineered feature

สร้างโมเดล regression อีกตัวโดยใช้ feature ใหม่ร่วมกับตัวเดิม

lr_height_2 <- 
lm(height ~ time + time_2, data = df_2)

จากนั้นพล็อตกราฟแสดงค่าพยากรณ์ใหม่

df_2 <- df_2 %>%
    bind_cols(lr2_pred = predict(lr_height_2))
df_2 %>%
  ggplot(aes(x = time, y = height)) +
  geom_point() +
  geom_line(aes(y = lr2_pred), 
      col = "blue", lwd = .75) +
  theme_classic()

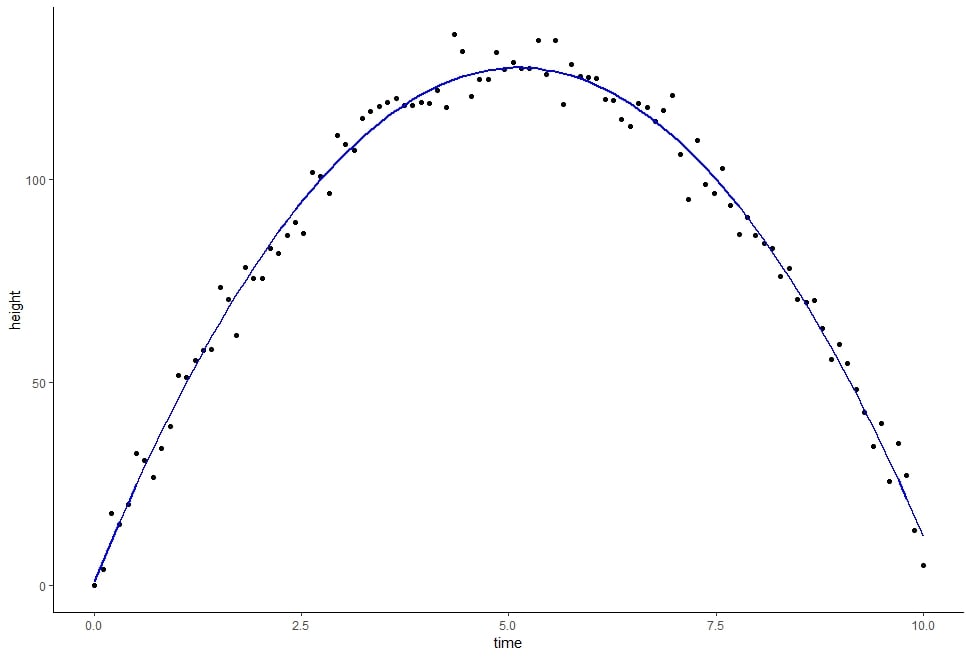
ผลลัพธ์ดีขึ้นอย่างเห็นได้ชัด โดยไม่ต้องเปลี่ยนโมเดลเลย

ความสูง เทียบกับ time และ time_2
Feature Engineering in R

มาฝึกกันเถอะ!

Feature Engineering in R

Preparing Video For Download...