Professional Quantitative Analyst and R programmer
ตัวชี้วัดการเทรด
TTR: ชุดเครื่องมือตัวชี้วัดการเทรดแบบดั้งเดิม
SMA (Simple Moving Average)
นิยมใช้ใน CTA: ค่าเฉลี่ยเคลื่อนที่ 200 วัน
แสดงทิศทางราคาในช่วง 10 เดือนที่ผ่านมา
การใช้ SMA()
# Compute a simple moving average (SMA) across 200 days
sma <- SMA(x = Cl(LQD), n = 200)

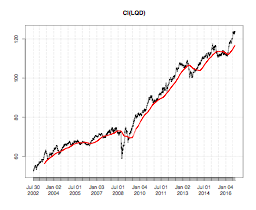
# Add the SMA line to your plot of LQD closing price
plot(Cl(LQD))
lines(sma, col = "red")