การกรองตามเวลา

การวิเคราะห์เครือข่ายระดับกลางใน Python

Eric Ma

Data Carpentry instructor and author of nxviz package

แนวคิดหลัก

  • การกรองกราฟ

  • Datetime

  • การแสดงผล

การวิเคราะห์เครือข่ายระดับกลางใน Python

การกรอง edge

list(G.edges(data=True))[0:5]
[(0, 17, {'sale_count': 1}),
 (0, 18, {'sale_count': 1}),
 (0, 19, {'sale_count': 2}),
 (0, 12, {'sale_count': 14}),
 (0, 13, {'sale_count': 9})]
[(u, v) for u, v, d in G.edges(data=True) if d['sale_count'] >= 10]
[(0, 12), (1, 19), (5, 16), (6, 13), (7, 17), (7, 19), (8, 18)]
การวิเคราะห์เครือข่ายระดับกลางใน Python

Datetime

from datetime import datetime, timedelta

year = 2011 month = 11 day1 = 10 day2 = 6
date1 = datetime(year, month, day1) date2 = datetime(year, month, day2)
date1 > date2
True
การวิเคราะห์เครือข่ายระดับกลางใน Python

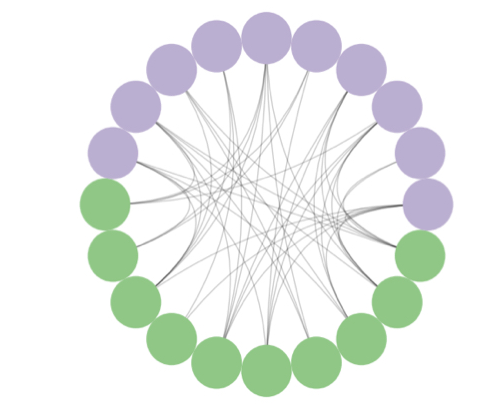
การแสดงผลกราฟ

from nxviz import circos
c = circos(G, group_by='bipartite',
              node_color_by='bipartite')

plt.show()

ch4-2.019.png

การวิเคราะห์เครือข่ายระดับกลางใน Python

มาฝึกกันเถอะ!

การวิเคราะห์เครือข่ายระดับกลางใน Python

Preparing Video For Download...