กราฟสองส่วน

การวิเคราะห์เครือข่ายระดับกลางใน Python

Eric Ma

Data Carpentry instructor and author of nxviz package

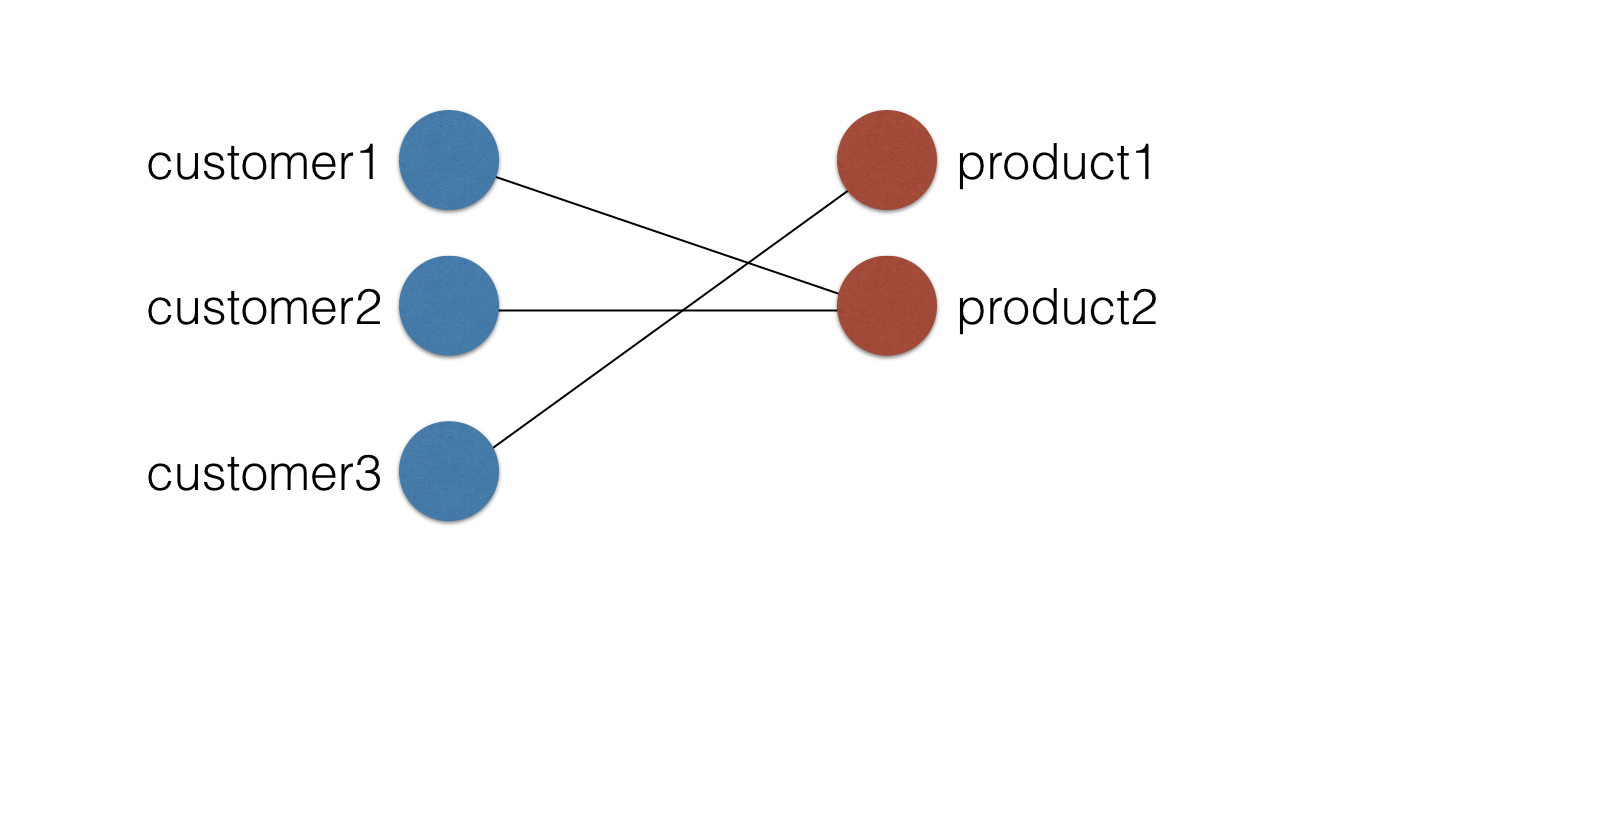
กราฟสองส่วน

  • กราฟที่แบ่งโหนดออกเป็นสองกลุ่ม
  • โหนดเชื่อมต่อได้เฉพาะกับโหนดในกลุ่มอื่นเท่านั้น
  • ตรงข้ามกับ: "unipartite"
การวิเคราะห์เครือข่ายระดับกลางใน Python

กราฟสองส่วน: ตัวอย่าง

ch1-2.007.png

การวิเคราะห์เครือข่ายระดับกลางใน Python

กราฟสองส่วนใน NetworkX

import networkx as nx
G = nx.Graph()

numbers = range(3) G.add_nodes_from(numbers, bipartite='customers')
letters = ['a', 'b'] G.add_nodes_from(letters, bipartite='products')
การวิเคราะห์เครือข่ายระดับกลางใน Python

กราฟสองส่วนใน NetworkX

list(G.nodes(data=True))
[(0, {'bipartite': 'customers'}),
 (1, {'bipartite': 'customers'}),
 (2, {'bipartite': 'customers'}),
 ('b', {'bipartite': 'products'}),
 ('a', {'bipartite': 'products'})]
การวิเคราะห์เครือข่ายระดับกลางใน Python

ค่าความเป็นศูนย์กลางตามดีกรี

  • นิยาม: $$\frac{\text{จำนวนเพื่อนบ้าน}}{\text{จำนวนเพื่อนบ้านที่เป็นไปได้}}$$
  • จำนวนเพื่อนบ้านที่เป็นไปได้ขึ้นอยู่กับประเภทของกราฟ
การวิเคราะห์เครือข่ายระดับกลางใน Python

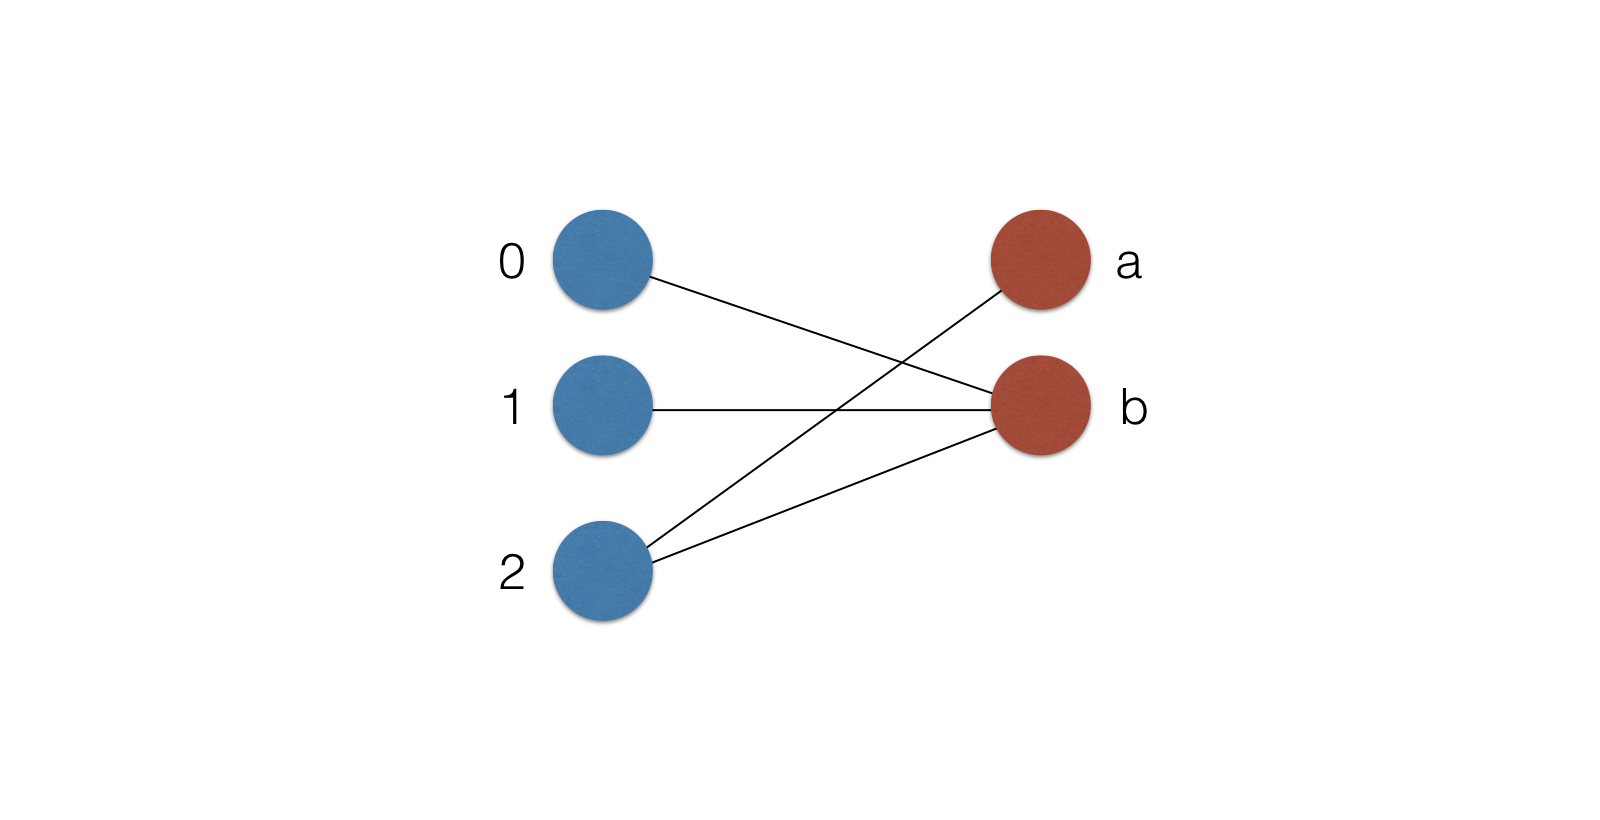
เมตริกความเป็นศูนย์กลางสำหรับกราฟสองส่วน

  • ตัวหาร: จำนวนโหนดในกลุ่มตรงข้าม แทนที่จะเป็นโหนดอื่นทั้งหมด
ch1-2.021.png

การวิเคราะห์เครือข่ายระดับกลางใน Python

การกรองกราฟ

cust_nodes = [n for n, d in G.nodes(data=True) if  
                  d['bipartite'] == 'customers']
cust_nodes
[(0, {'bipartite': 'customers'}),
 (1, {'bipartite': 'customers'}),
 (2, {'bipartite': 'customers'})]
nx.bipartite.degree_centrality(G, cust_nodes)
{0: 0.5,
 1: 0.5,
 2: 1.0,
 'a': 0.333,
 'b': 1.0}
การวิเคราะห์เครือข่ายระดับกลางใน Python

มาฝึกกันเถอะ!

การวิเคราะห์เครือข่ายระดับกลางใน Python

Preparing Video For Download...