กราฟสองส่วนและระบบแนะนำ

การวิเคราะห์เครือข่ายระดับกลางใน Python

Eric Ma

Data Carpentry instructor and author of nxviz package

ระบบแนะนำ
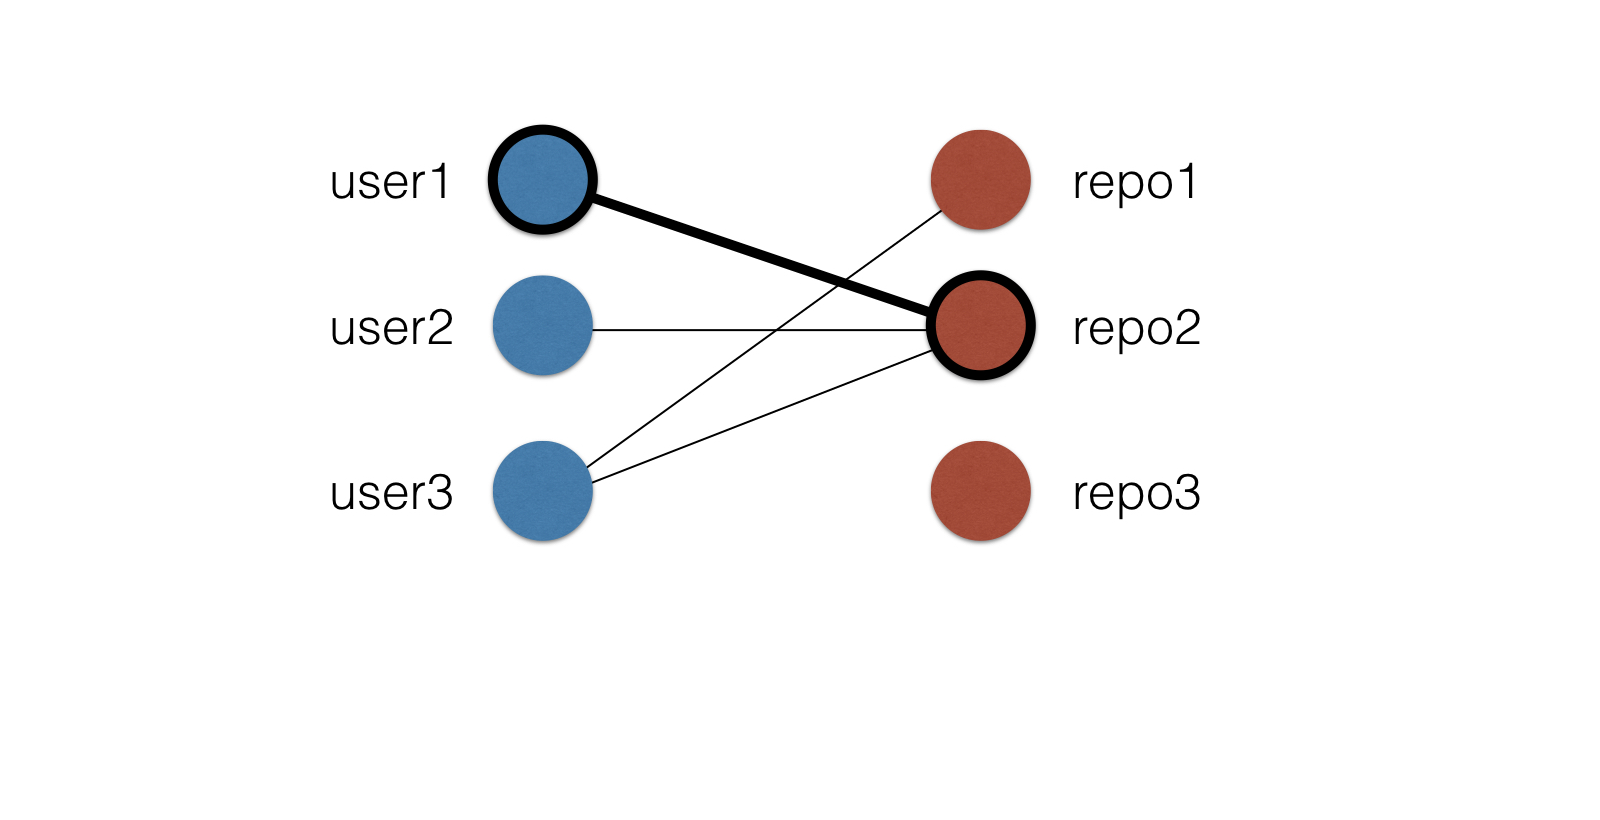
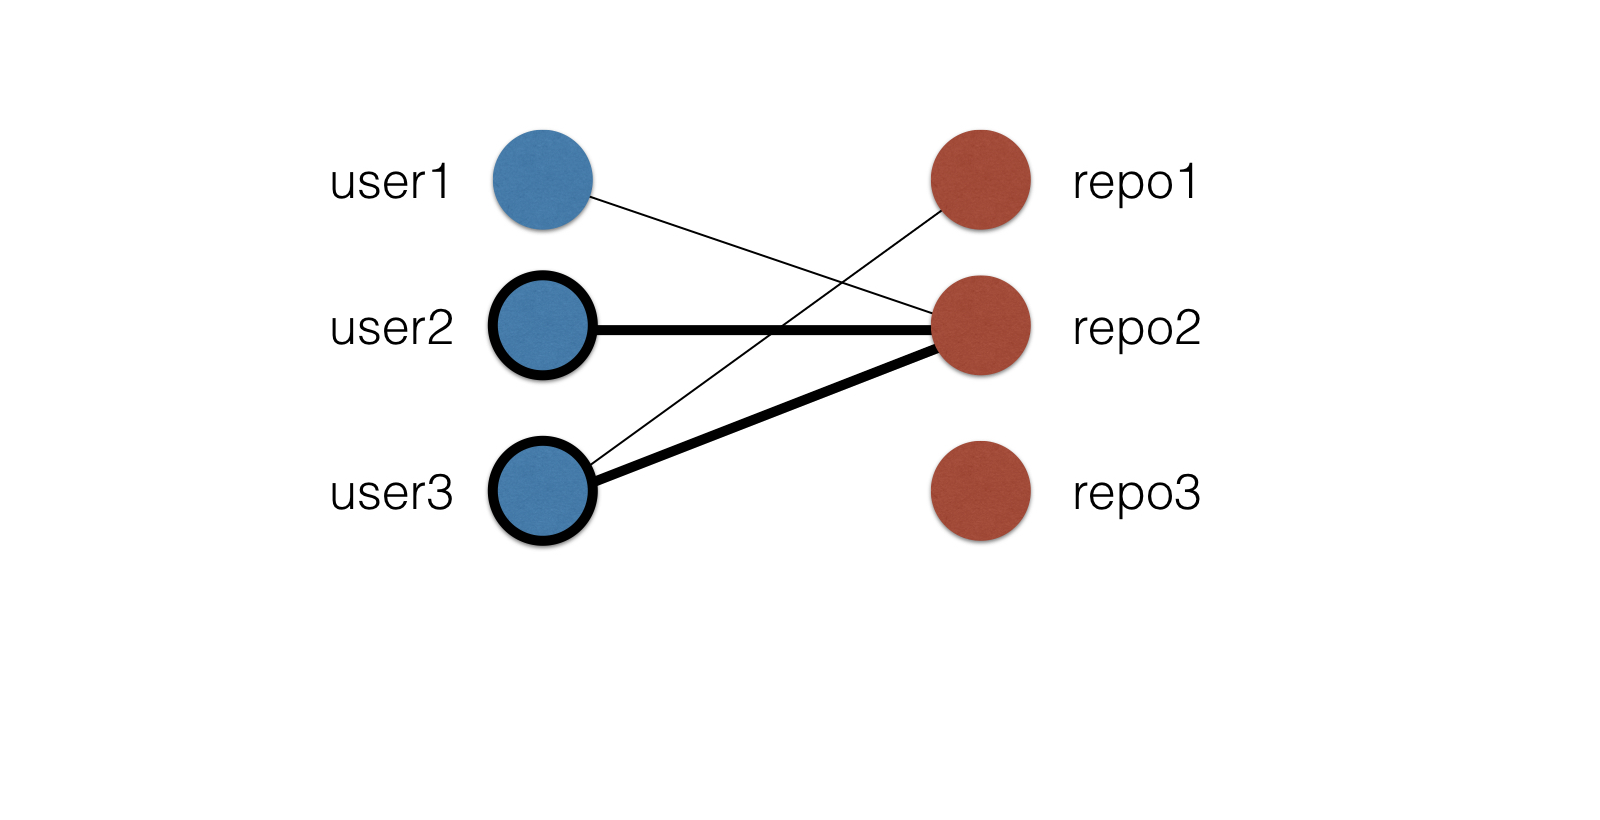
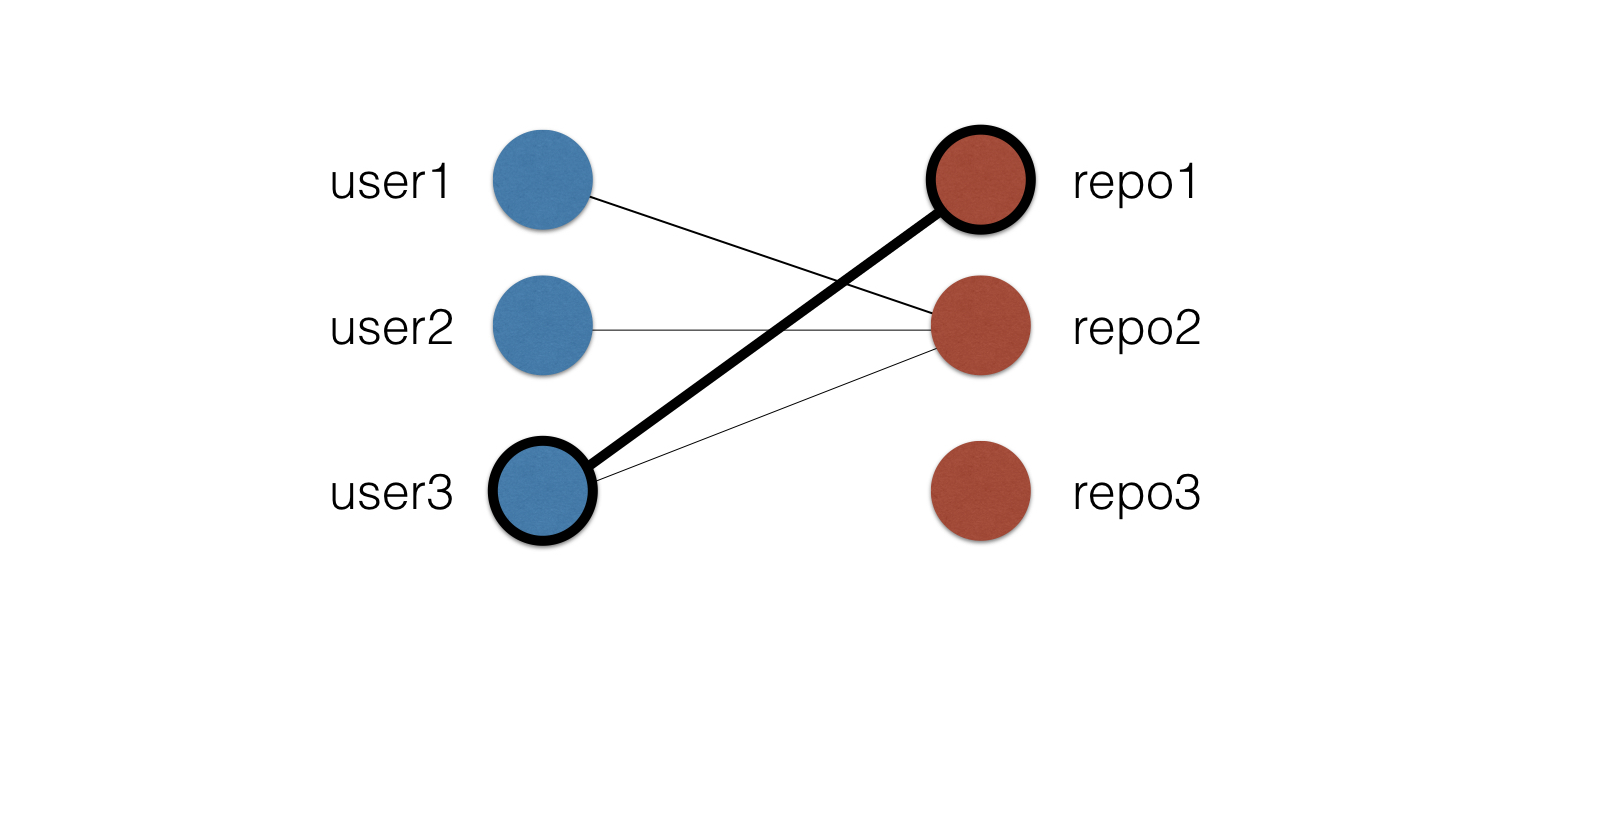
  • ก่อนหน้านี้: แนะนำผู้ใช้ให้เชื่อมต่อกัน
  • กราฟแบบ "unipartite" (เฉพาะผู้ใช้)
  • ตอนนี้: แบบ "bipartite" (repo-ผู้ใช้)
  • แนะนำ repository ให้ผู้ใช้ทำงาน
การวิเคราะห์เครือข่ายระดับกลางใน Python

ระบบแนะนำ

ch1-3.007.png

การวิเคราะห์เครือข่ายระดับกลางใน Python

ระบบแนะนำ

ch1-3.008.png

การวิเคราะห์เครือข่ายระดับกลางใน Python

ระบบแนะนำ

ch1-3.009.png

การวิเคราะห์เครือข่ายระดับกลางใน Python

โค้ด: ชุดโหนด

list(G.nodes(data=True))
[('repo3', {'bipartite': 'repositories'}),
 ('repo1', {'bipartite': 'repositories'}),
 ('user1', {'bipartite': 'users'}),
 ('user2', {'bipartite': 'users'}),
 ('repo2', {'bipartite': 'repositories'}),
 ('user3', {'bipartite': 'users'})]
list(G.edges())
[('repo1', 'user3'),
 ('user1', 'repo2'),
 ('user2', 'repo2'),
 ('repo2', 'user3')]
การวิเคราะห์เครือข่ายระดับกลางใน Python

โค้ด: ชุดโหนด

user1_nbrs = G.neighbors('user1')

user1_nbrs
['repo2']
user3_nbrs = G.neighbors('user3')
user3_nbrs
['repo2', 'repo1']
การวิเคราะห์เครือข่ายระดับกลางใน Python

โค้ด: ชุดโหนด

set(user1_nbrs).intersection(user3_nbrs)
{'repo2'}
set(user3_nbrs).difference(user1_nbrs)
{'repo1'}
การวิเคราะห์เครือข่ายระดับกลางใน Python

มาฝึกกันเถอะ!

การวิเคราะห์เครือข่ายระดับกลางใน Python

Preparing Video For Download...