ฟีเจอร์ขั้นสูงเพื่อปรับปรุงกราฟ

กรณีศึกษา: การสร้างเว็บแอปพลิเคชันด้วย Shiny ใน R

Dean Attali

Shiny Consultant

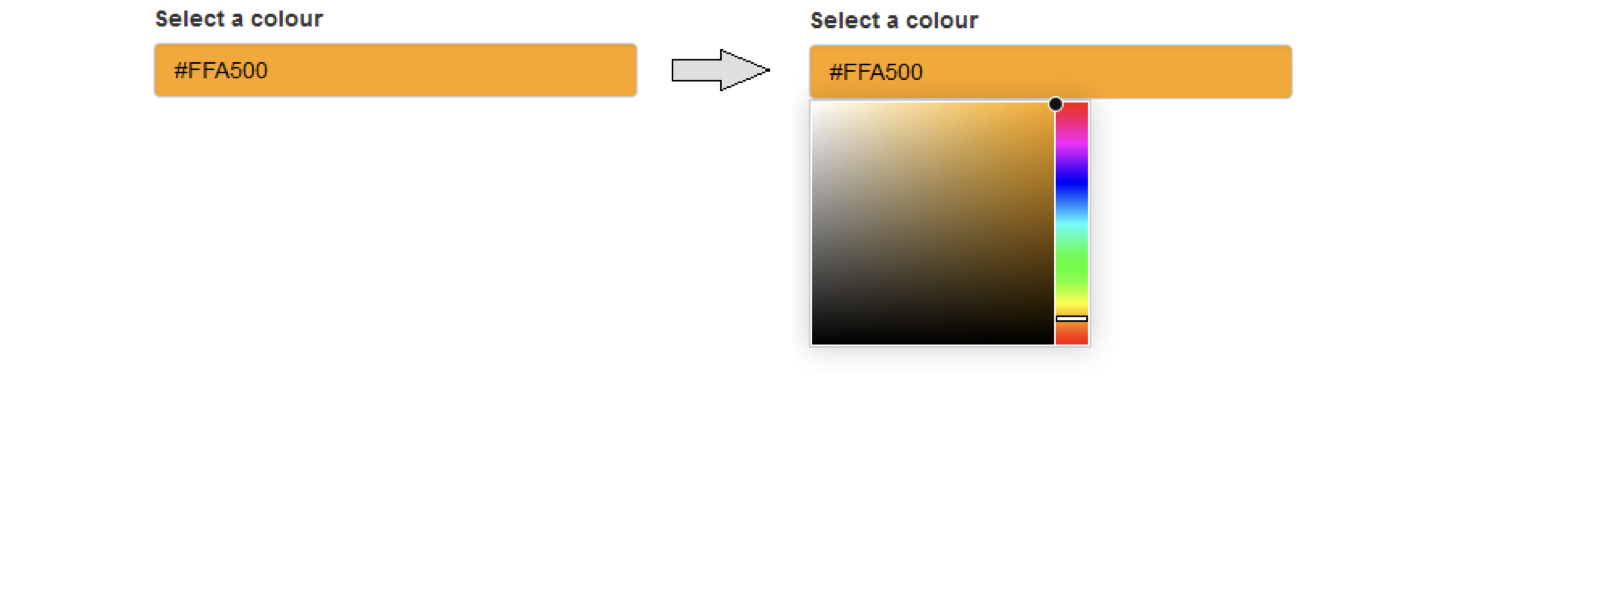
Color input

library(colourpicker)

colourInput("col", "Select a colour", value = "orange")
chapter2_4_advanced_features_to_improve_your_plot.006.png

กรณีศึกษา: การสร้างเว็บแอปพลิเคชันด้วย Shiny ใน R

Output มี argument ได้

plotOutput(outputId, width = "100%", height = "400px",
           click = NULL, dblclick = NULL, hover = NULL,
           hoverDelay = NULL, hoverDelayType = NULL, 
           brush = NULL, clickId = NULL, hoverId = NULL,
           inline = FALSE)
กรณีศึกษา: การสร้างเว็บแอปพลิเคชันด้วย Shiny ใน R

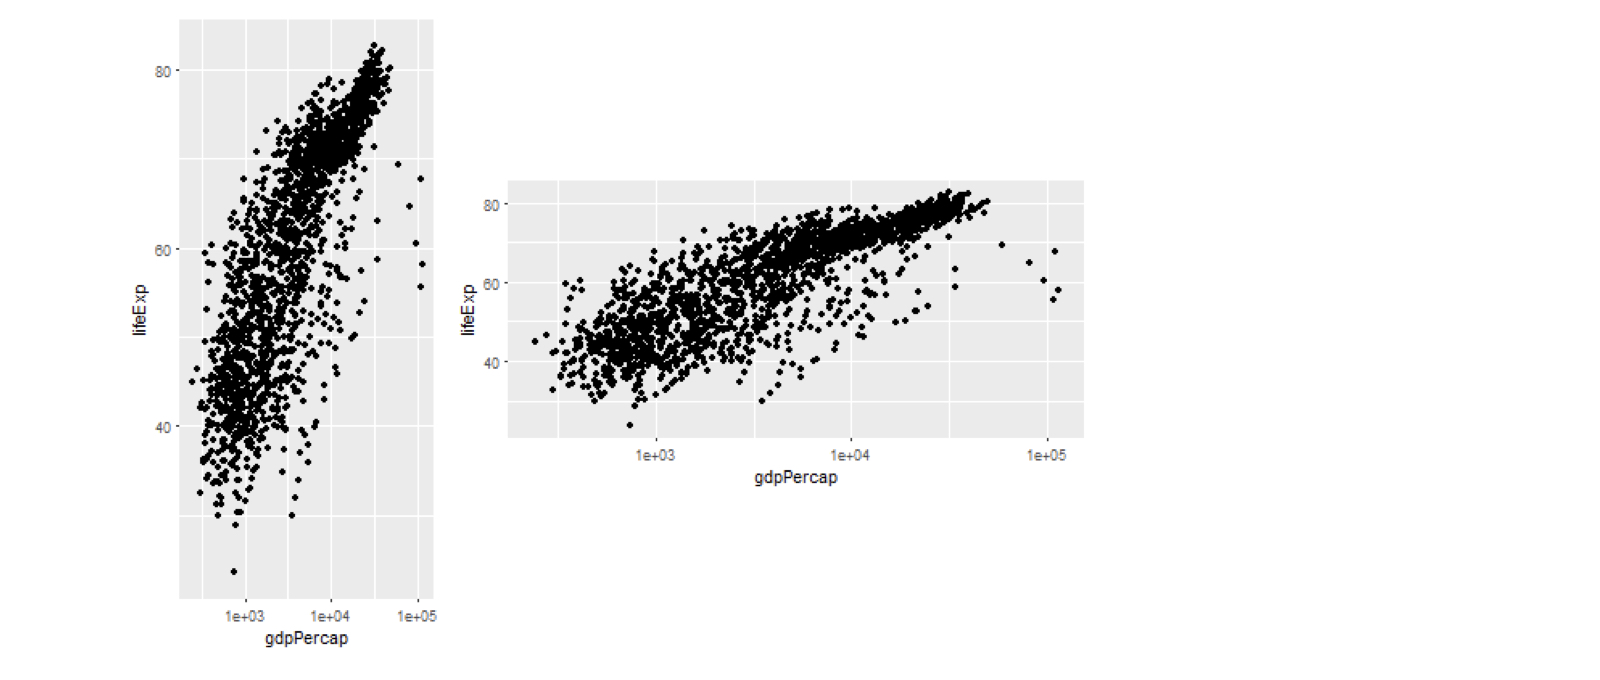
argument ของ plot output

plotOutput("plot1", width = 200, height = 400)
plotOutput("plot2", width = 400, height = 200)
chapter2_4_advanced_features_to_improve_your_plot.008.png

กรณีศึกษา: การสร้างเว็บแอปพลิเคชันด้วย Shiny ใน R

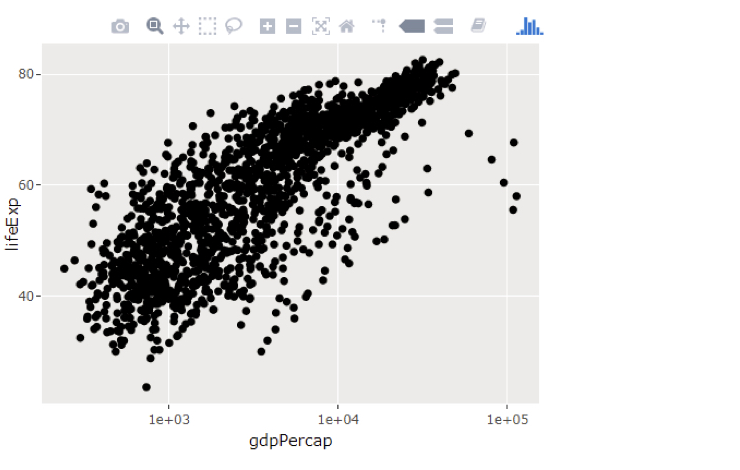
กราฟเชิงโต้ตอบด้วย plotly

  • มีหลายแพ็กเกจสำหรับกราฟเชิงโต้ตอบ
  • plotly เป็นตัวเลือกยอดนิยม
  • ggplotly():
    • แปลง ggplot2 ให้เป็น interactive
p <- ggplot(gapminder, 
          aes(gdpPercap, lifeExp)) +
     geom_point() +
     scale_x_log10()

library(plotly)
ggplotly(p)

chapter2_4_advanced_features_to_improve_your_plot.015.png

กรณีศึกษา: การสร้างเว็บแอปพลิเคชันด้วย Shiny ใน R

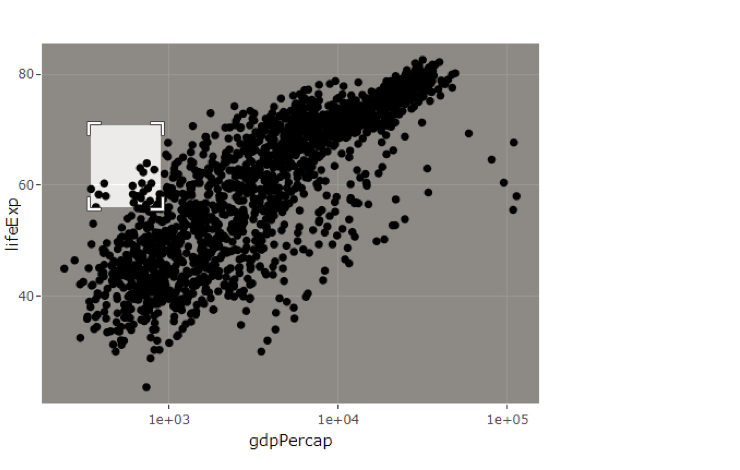
กราฟเชิงโต้ตอบด้วย plotly

  • มีหลายแพ็กเกจสำหรับกราฟเชิงโต้ตอบ
  • plotly เป็นตัวเลือกยอดนิยม
  • ggplotly():
    • แปลง ggplot2 ให้เป็น interactive
p <- ggplot(gapminder, 
          aes(gdpPercap, lifeExp)) +
     geom_point() +
     scale_x_log10()

library(plotly)
ggplotly(p)

chapter2_4_advanced_features_to_improve_your_plot.016.png

กรณีศึกษา: การสร้างเว็บแอปพลิเคชันด้วย Shiny ใน R

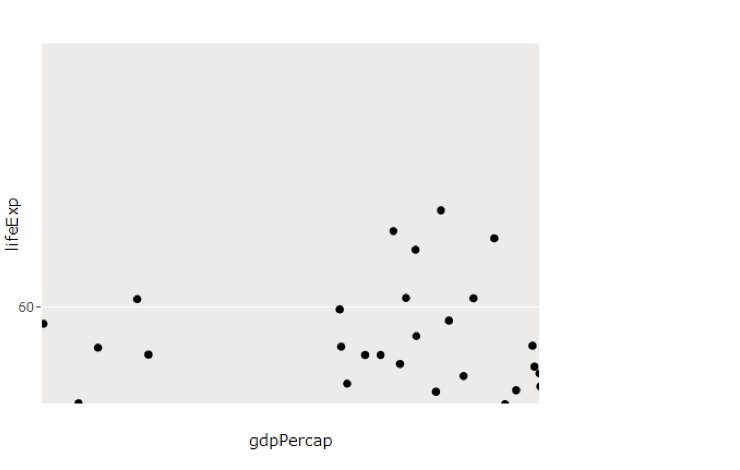
กราฟเชิงโต้ตอบด้วย plotly

  • มีหลายแพ็กเกจสำหรับกราฟเชิงโต้ตอบ
  • plotly เป็นตัวเลือกยอดนิยม
  • ggplotly():
    • แปลง ggplot2 ให้เป็น interactive
p <- ggplot(gapminder, 
          aes(gdpPercap, lifeExp)) +
     geom_point() +
     scale_x_log10()

library(plotly)
ggplotly(p)

chapter2_4_advanced_features_to_improve_your_plot.017.png

กรณีศึกษา: การสร้างเว็บแอปพลิเคชันด้วย Shiny ใน R

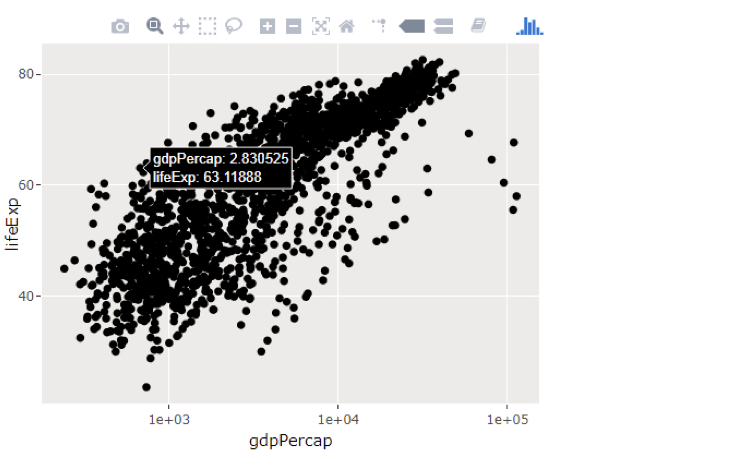
กราฟเชิงโต้ตอบด้วย plotly

  • มีหลายแพ็กเกจสำหรับกราฟเชิงโต้ตอบ
  • plotly เป็นตัวเลือกยอดนิยม
  • ggplotly():
    • แปลง ggplot2 ให้เป็น interactive
p <- ggplot(gapminder, 
          aes(gdpPercap, lifeExp)) +
     geom_point() +
     scale_x_log10()

library(plotly)
ggplotly(p)

chapter2_4_advanced_features_to_improve_your_plot.018.png

กรณีศึกษา: การสร้างเว็บแอปพลิเคชันด้วย Shiny ใน R

Plotly ใน Shiny

  • ไม่ถูกต้อง
plotOutput("plot")
renderPlot(ggplotly(p))
  • ถูกต้อง
plotlyOutput("plot")
renderPlotly(ggplotly(p))
กรณีศึกษา: การสร้างเว็บแอปพลิเคชันด้วย Shiny ใน R

มาฝึกกันเถอะ!

กรณีศึกษา: การสร้างเว็บแอปพลิเคชันด้วย Shiny ใน R

Preparing Video For Download...