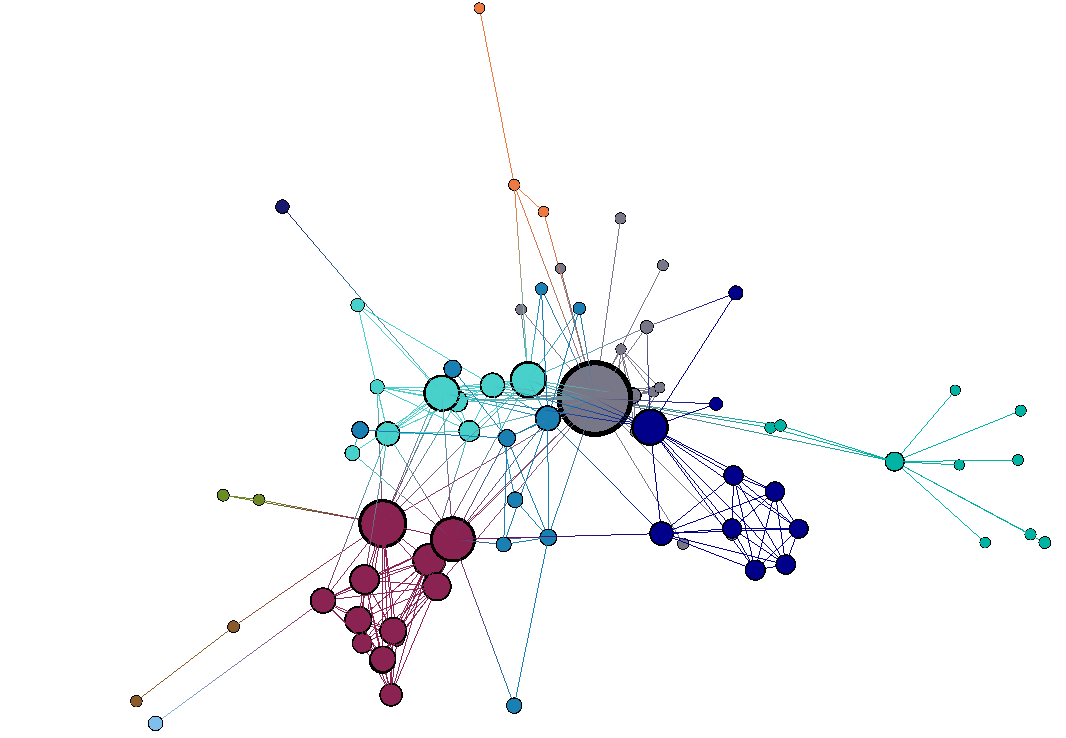
การแสดงผลเครือข่ายแบบอินเทอร์แอกทีฟ

การวิเคราะห์เครือข่ายใน R

James Curley

Associate Professor, University of Texas at Austin

แพ็กเกจแสดงผลเครือข่ายใน R

  • igraph
  • statnet
  • ggnet
  • ggnetwork
  • ggraph
  • visNetwork
  • networkD3
  • sigma
  • rgexf (igraph to Gephi)
  • threejs
การวิเคราะห์เครือข่ายใน R

threejs

การวิเคราะห์เครือข่ายใน R

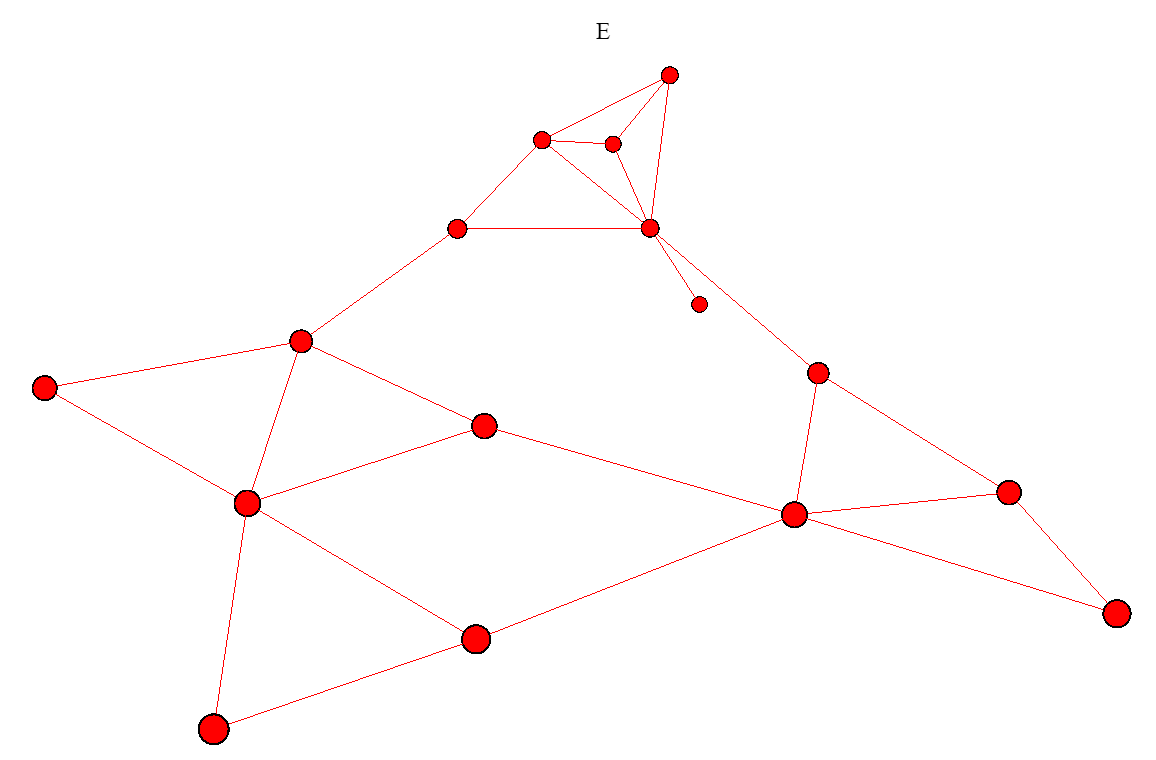
สร้างการแสดงผลด้วย threejs

library(threejs)
graphjs(g)
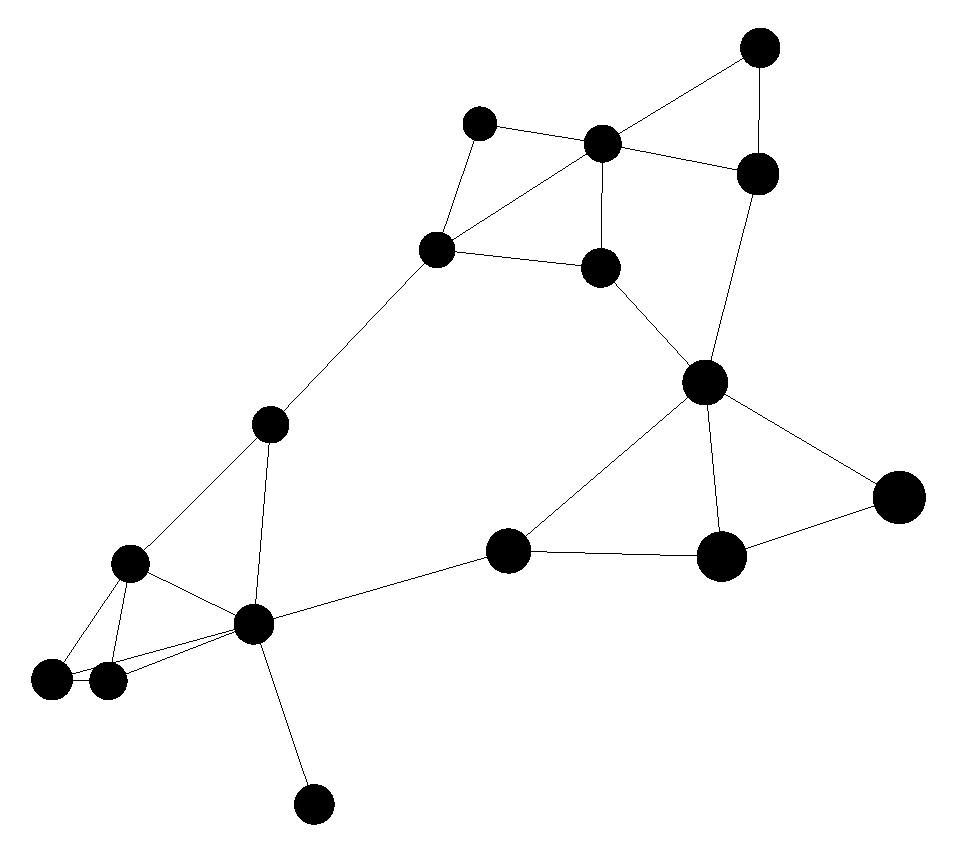
การวิเคราะห์เครือข่ายใน R

การเพิ่ม Attributes

g <- set_vertex_attr(
  g, 
  "label", 
  value = V(g)$name
  )

g <- set_vertex_attr(
  g, 
  "color", 
  value = "mistyrose"
  )

graphjs(g, vertex.size = 1)

การวิเคราะห์เครือข่ายใน R

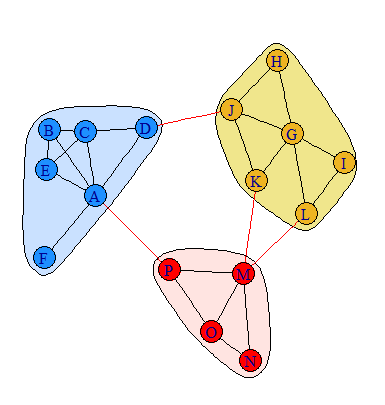
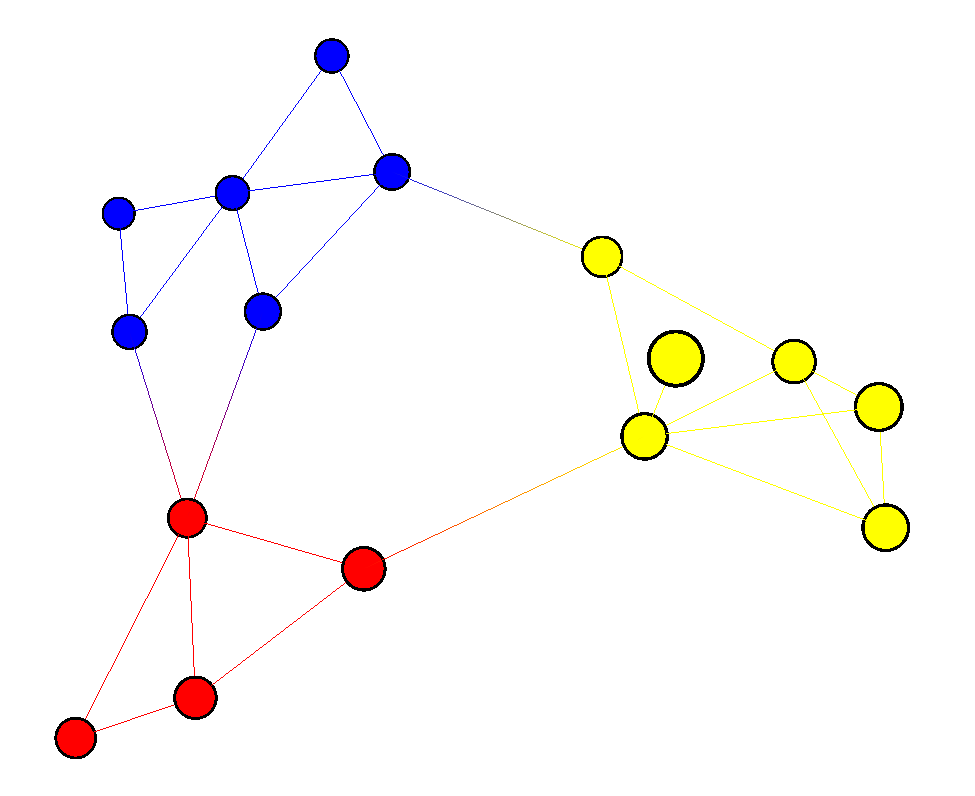
การระบายสีกลุ่ม (Communities)

x = edge.betweenness.community(g)
i <-  membership(x)

g <- set_vertex_attr(
  g, 
  "color", 
  value = c(
    "yellow", "blue", "red"
    )[i]
  )

graphjs(g)

การวิเคราะห์เครือข่ายใน R

มาฝึกกันเถอะ!

การวิเคราะห์เครือข่ายใน R

Preparing Video For Download...