การสร้างแผนที่ข้อมูลประชากรด้วย ggplot2

การวิเคราะห์ข้อมูลสำมะโนประชากรสหรัฐฯ ใน R

Kyle Walker

Instructor
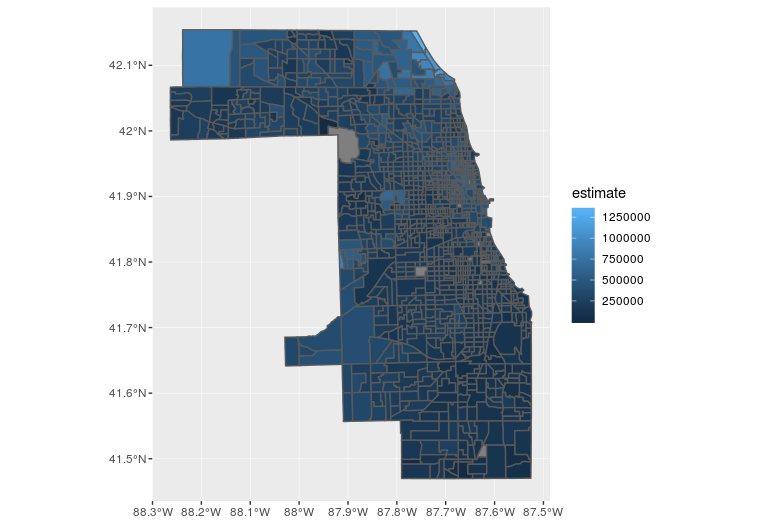
แผนที่ Choropleth เบื้องต้นด้วย geom_sf()

library(ggplot2)

ggplot(cook_value, aes(fill = estimate)) + 
  geom_sf()
การวิเคราะห์ข้อมูลสำมะโนประชากรสหรัฐฯ ใน R

แผนที่ ggplot แรกของ Cook County

การวิเคราะห์ข้อมูลสำมะโนประชากรสหรัฐฯ ใน R

ปรับแต่งสีของแผนที่

ggplot(cook_value, aes(fill = estimate, color = estimate)) + 
  geom_sf() + 
  scale_fill_viridis_c() +  
  scale_color_viridis_c()
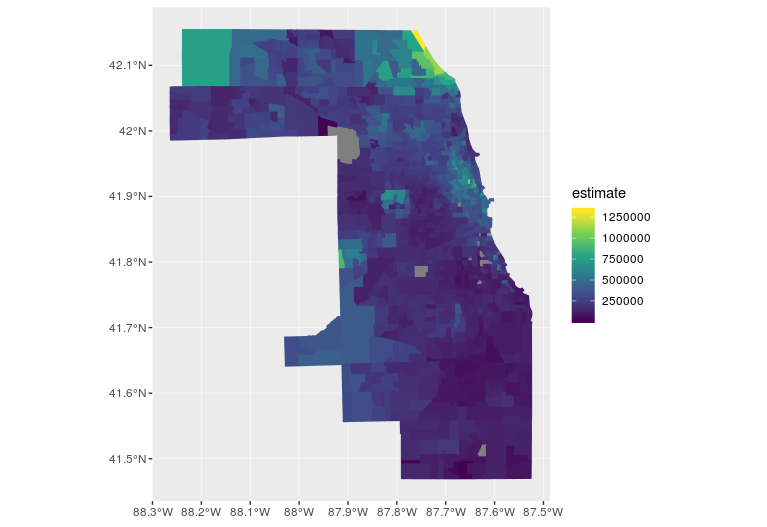
แผนที่ Cook County ด้วย viridis

การวิเคราะห์ข้อมูลสำมะโนประชากรสหรัฐฯ ใน R

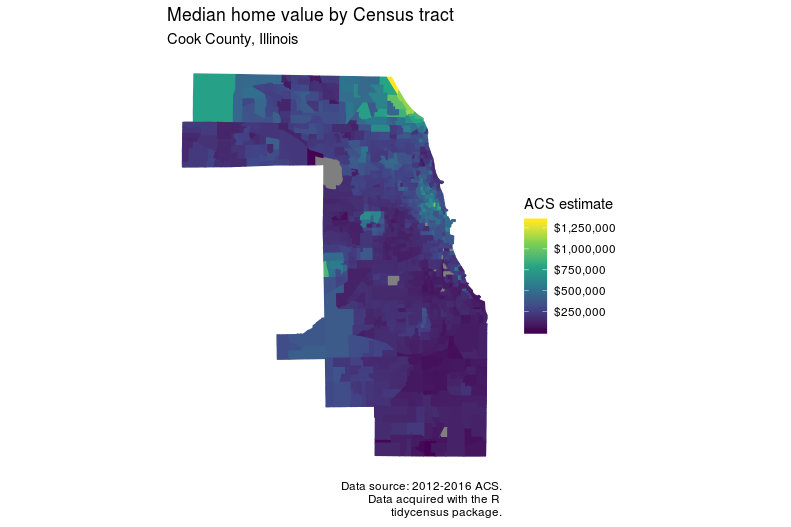
ปรับแต่งผลลัพธ์ของแผนที่

ggplot(cook_value, aes(fill = estimate, color = estimate)) + 
  geom_sf() + 
  scale_fill_viridis_c(labels = scales::dollar) +  
  scale_color_viridis_c(guide = FALSE) + 
  theme_minimal() + 
  coord_sf(crs = 26916, datum = NA) + 
  labs(title = "Median home value by Census tract", 
       subtitle = "Cook County, Illinois", 
       caption = "Data source: 2012-2016 ACS.\nData acquired with the R 
                  tidycensus package.", 
       fill = "ACS estimate")
การวิเคราะห์ข้อมูลสำมะโนประชากรสหรัฐฯ ใน R

แผนที่ Cook County ที่จัดรูปแบบแล้วด้วย ggplot

การวิเคราะห์ข้อมูลสำมะโนประชากรสหรัฐฯ ใน R

มาฝึกกันเถอะ!

การวิเคราะห์ข้อมูลสำมะโนประชากรสหรัฐฯ ใน R

Preparing Video For Download...