การวิเคราะห์ข้อมูลสำมะโนประชากรสหรัฐฯ ใน R
Kyle Walker
Instructor
library(tidycensus)
library(tidyverse)

ne_income <- get_acs(geography = "state",
                     variables = "B19013_001",
                     survey = "acs1",
                     state = c("ME", "NH", "VT", "MA",
                               "RI", "CT", "NY"))

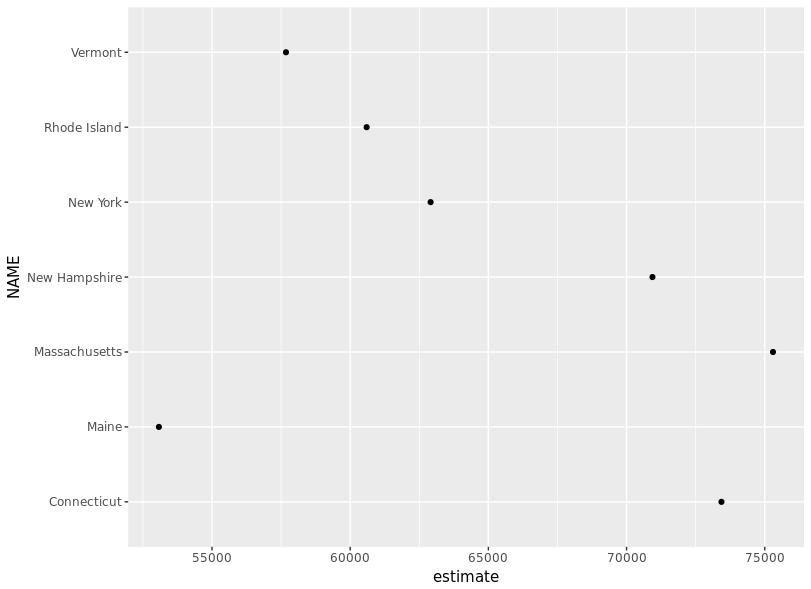
ggplot(ne_income, aes(x = estimate, y = NAME)) +
  geom_point()
library(tidycensus) library(tidyverse) ne_income <- get_acs(geography = "state", variables = "B19013_001", survey = "acs1", state = c("ME", "NH", "VT", "MA", "RI", "CT", "NY"))
ggplot(ne_income, aes(x = estimate, y = NAME)) + geom_point()
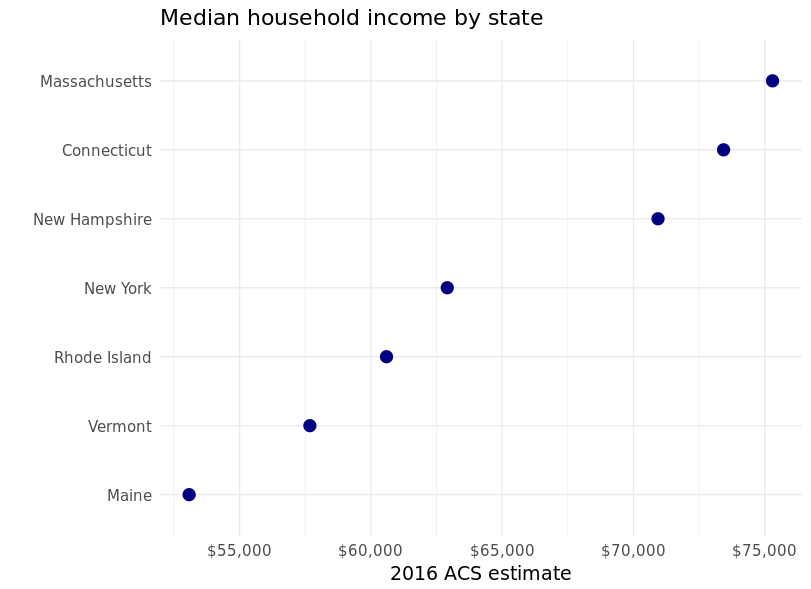
ggplot(ne_income,
       aes(x = estimate,
           y = reorder(NAME, estimate))) +
  geom_point(color = "navy", size = 4) +

  scale_x_continuous(labels = scales::dollar) +

  theme_minimal(base_size = 14) +

  labs(x = "2016 ACS estimate",
       y = "",
       title = "Median household income by state")
ggplot(ne_income, aes(x = estimate, y = reorder(NAME, estimate))) + geom_point(color = "navy", size = 4) +
scale_x_continuous(labels = scales::dollar) +
theme_minimal(base_size = 14) +
labs(x = "2016 ACS estimate", y = "", title = "Median household income by state")