Visualisering av big data med Trelliscope i R
Ryan Hafen
Author, TrelliscopeJS
Alla variabler i data som skickas till ggplot() granskas för användning som kognostiker.
gap <- gapminder %>% group_by(country) %>% mutate(latestLifeExp = tail(lifeExp, 1))gap
# A tibble: 1,704 x 7
# Groups: country [142]
country continent year lifeExp pop gdpPercap latestLifeExp
<fct> <fct> <int> <dbl> <int> <dbl> <dbl>
1 Afghanistan Asia 1952 28.8 8425333 779 43.8
2 Afghanistan Asia 1957 30.3 9240934 821 43.8
3 Afghanistan Asia 1962 32.0 10267083 853 43.8
4 Afghanistan Asia 1967 34.0 11537966 836 43.8
5 Afghanistan Asia 1972 36.1 13079460 740 43.8
6 Afghanistan Asia 1977 38.4 14880372 786 43.8
# ... with 1,698 more rows
gap <- gapminder %>%
group_by(country, continent) %>%
mutate(wiki = paste0("https://en.wikipedia.org/wiki/", country))
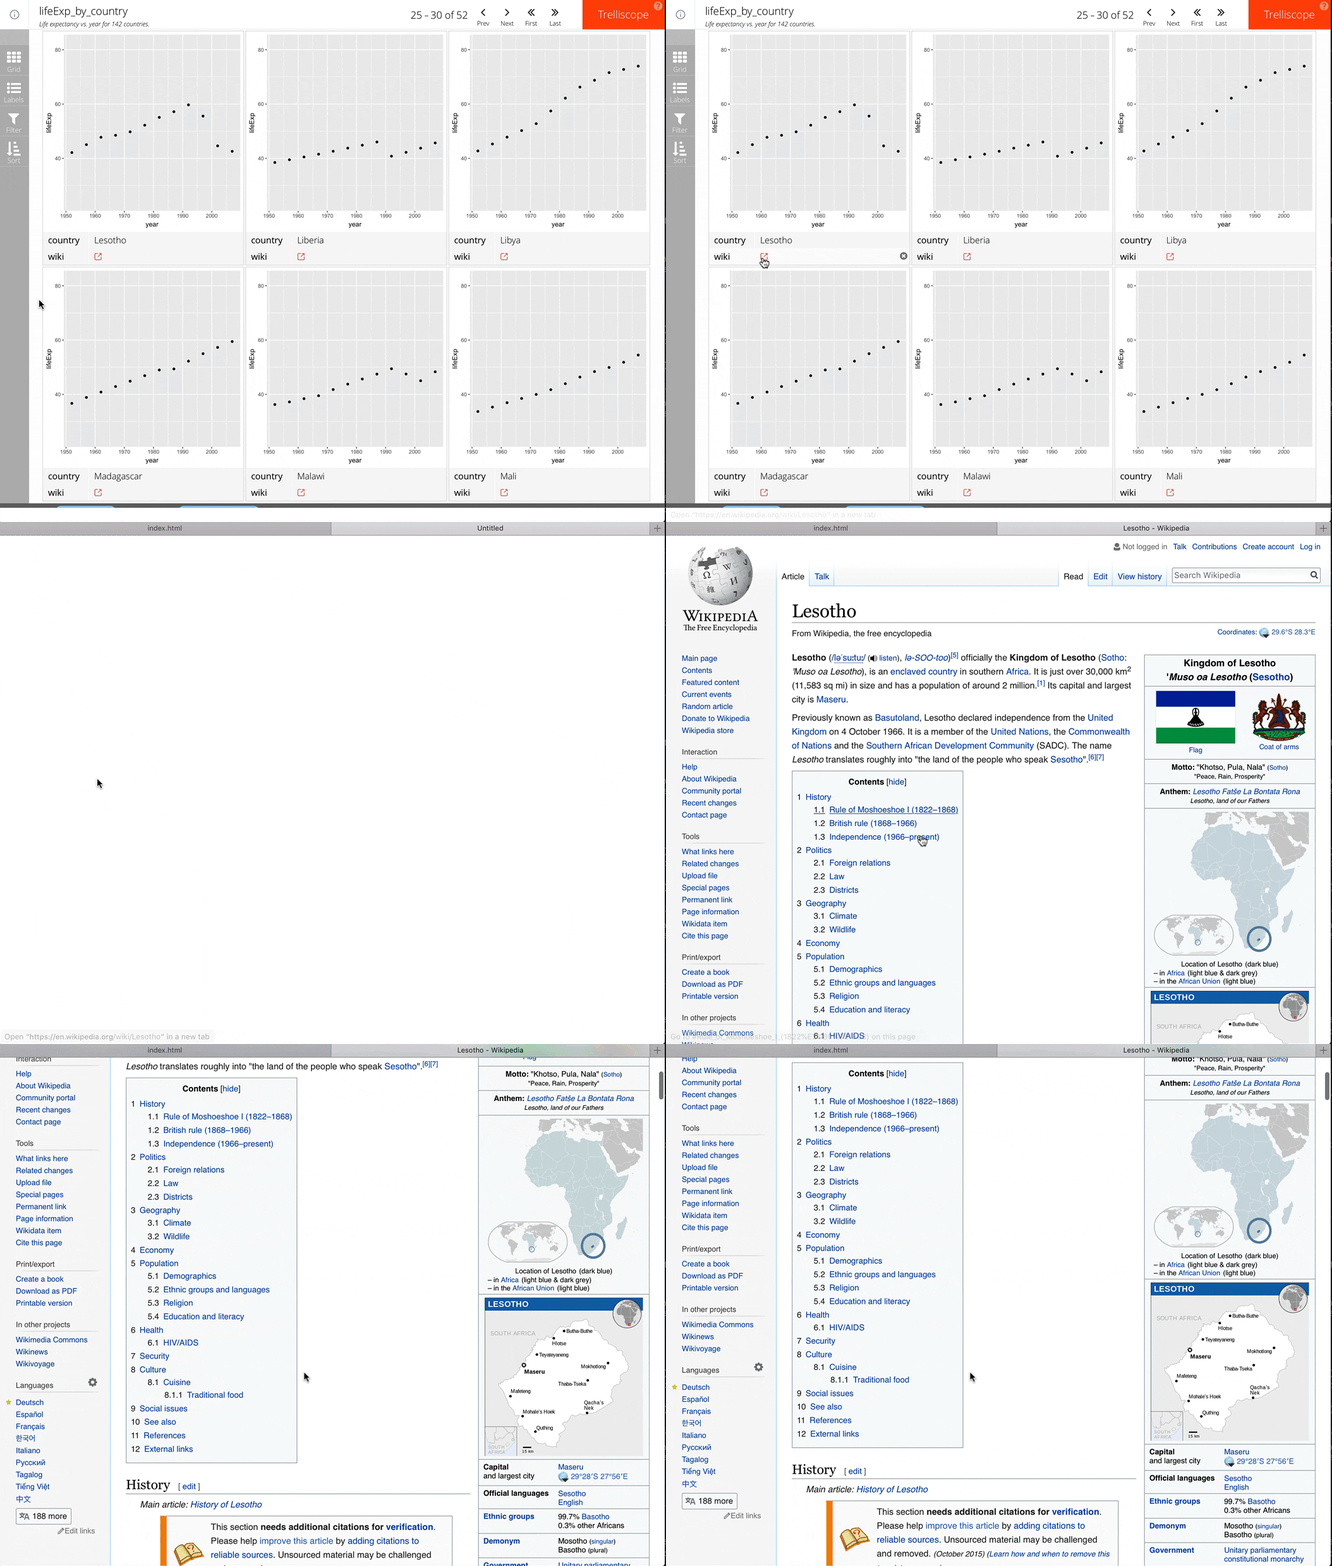
Funktionen cog() kan omsluta en variabel för att finjustera hur en kognostiker hanteras i Trelliscope.
Med cog() kan du bland annat ange:
desc: en beskrivande text för kognostikerndefault_label: ett booleskt värde som anger om kognostikern ska visas som etikett som standard eller integap$wiki <- cog_href(gap$wiki,
desc = "Link to wikipedia",
default_label = TRUE)
Visualisering av big data med Trelliscope i R