การเพิ่ม cognostics ของคุณเอง

การแสดงภาพข้อมูลขนาดใหญ่ด้วย Trelliscope ใน R

Ryan Hafen

Author, TrelliscopeJS

ตัวแปรใหม่ในฐานะ cognostics

ตัวแปรทั้งหมดในข้อมูลที่ส่งให้ ggplot() จะถูกตรวจสอบเพื่อใช้เป็น cognostics

  • หากตัวแปรเป็นตัวเลขและมีค่าแตกต่างกันในแต่ละกลุ่มแผง ระบบจะคำนวณสถิติสรุปสำหรับแต่ละแผง
  • หากตัวแปรมีค่าคงที่ในแต่ละกลุ่มแผง ระบบจะสร้าง cognostic เดียวด้วยค่านั้นสำหรับแต่ละแผง
การแสดงภาพข้อมูลขนาดใหญ่ด้วย Trelliscope ใน R

อายุขัยล่าสุดในฐานะ cognostic

gap <- gapminder %>%
  group_by(country) %>%
  mutate(latestLifeExp = tail(lifeExp, 1))

gap
# A tibble: 1,704 x 7
# Groups:   country [142]
   country     continent  year lifeExp      pop gdpPercap latestLifeExp
   <fct>       <fct>     <int>   <dbl>    <int>     <dbl>         <dbl>
 1 Afghanistan Asia       1952    28.8  8425333       779          43.8
 2 Afghanistan Asia       1957    30.3  9240934       821          43.8
 3 Afghanistan Asia       1962    32.0 10267083       853          43.8
 4 Afghanistan Asia       1967    34.0 11537966       836          43.8
 5 Afghanistan Asia       1972    36.1 13079460       740          43.8
 6 Afghanistan Asia       1977    38.4 14880372       786          43.8
# ... with 1,698 more rows
การแสดงภาพข้อมูลขนาดใหญ่ด้วย Trelliscope ใน R

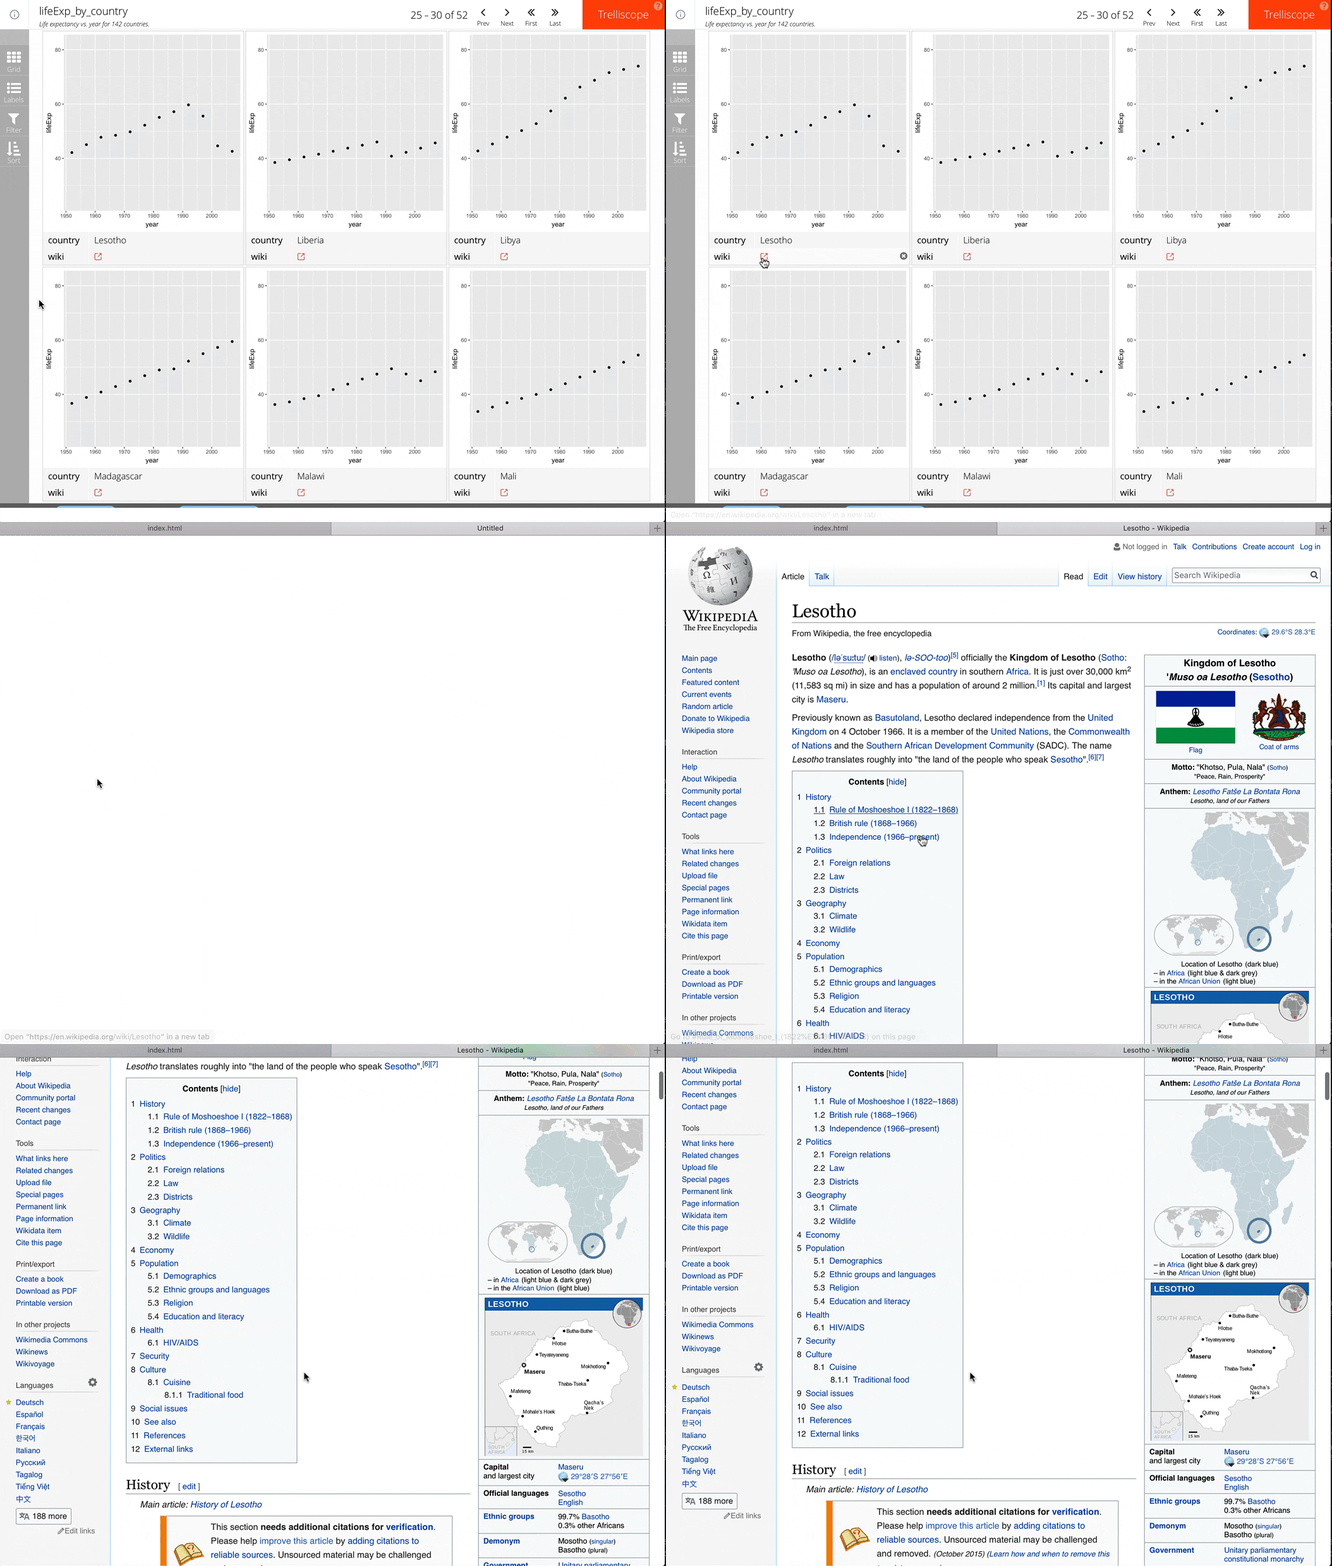
ไฮเปอร์ลิงก์ในฐานะ cognostics

gap <- gapminder %>%
  group_by(country, continent) %>%
  mutate(wiki = paste0("https://en.wikipedia.org/wiki/", country))
การแสดงภาพข้อมูลขนาดใหญ่ด้วย Trelliscope ใน R

ปรับแต่ง cognostics ที่กำหนดเอง

ฟังก์ชัน cog() สามารถครอบตัวแปรเพื่อปรับแต่งการจัดการ cognostic ใน Trelliscope ได้

สิ่งที่มีประโยชน์ที่สุดที่ระบุได้ใน cog() ได้แก่

  • desc: คำอธิบายที่มีความหมายสำหรับ cognostic
  • default_label: ค่าบูลีนที่ระบุว่าจะแสดง cognostic เป็น label ตามค่าเริ่มต้นหรือไม่
gap$wiki <- cog_href(gap$wiki, 
                     desc = "Link to wikipedia", 
                     default_label = TRUE)
การแสดงภาพข้อมูลขนาดใหญ่ด้วย Trelliscope ใน R

มาฝึกกันเถอะ!

การแสดงภาพข้อมูลขนาดใหญ่ด้วย Trelliscope ใน R

Preparing Video For Download...