ฟีเจอร์เพิ่มเติมของ TrelliscopeJS

การแสดงภาพข้อมูลขนาดใหญ่ด้วย Trelliscope ใน R

Ryan Hafen

Author, TrelliscopeJS

เพิ่ม Interactivity ให้แผงด้วย Plotly
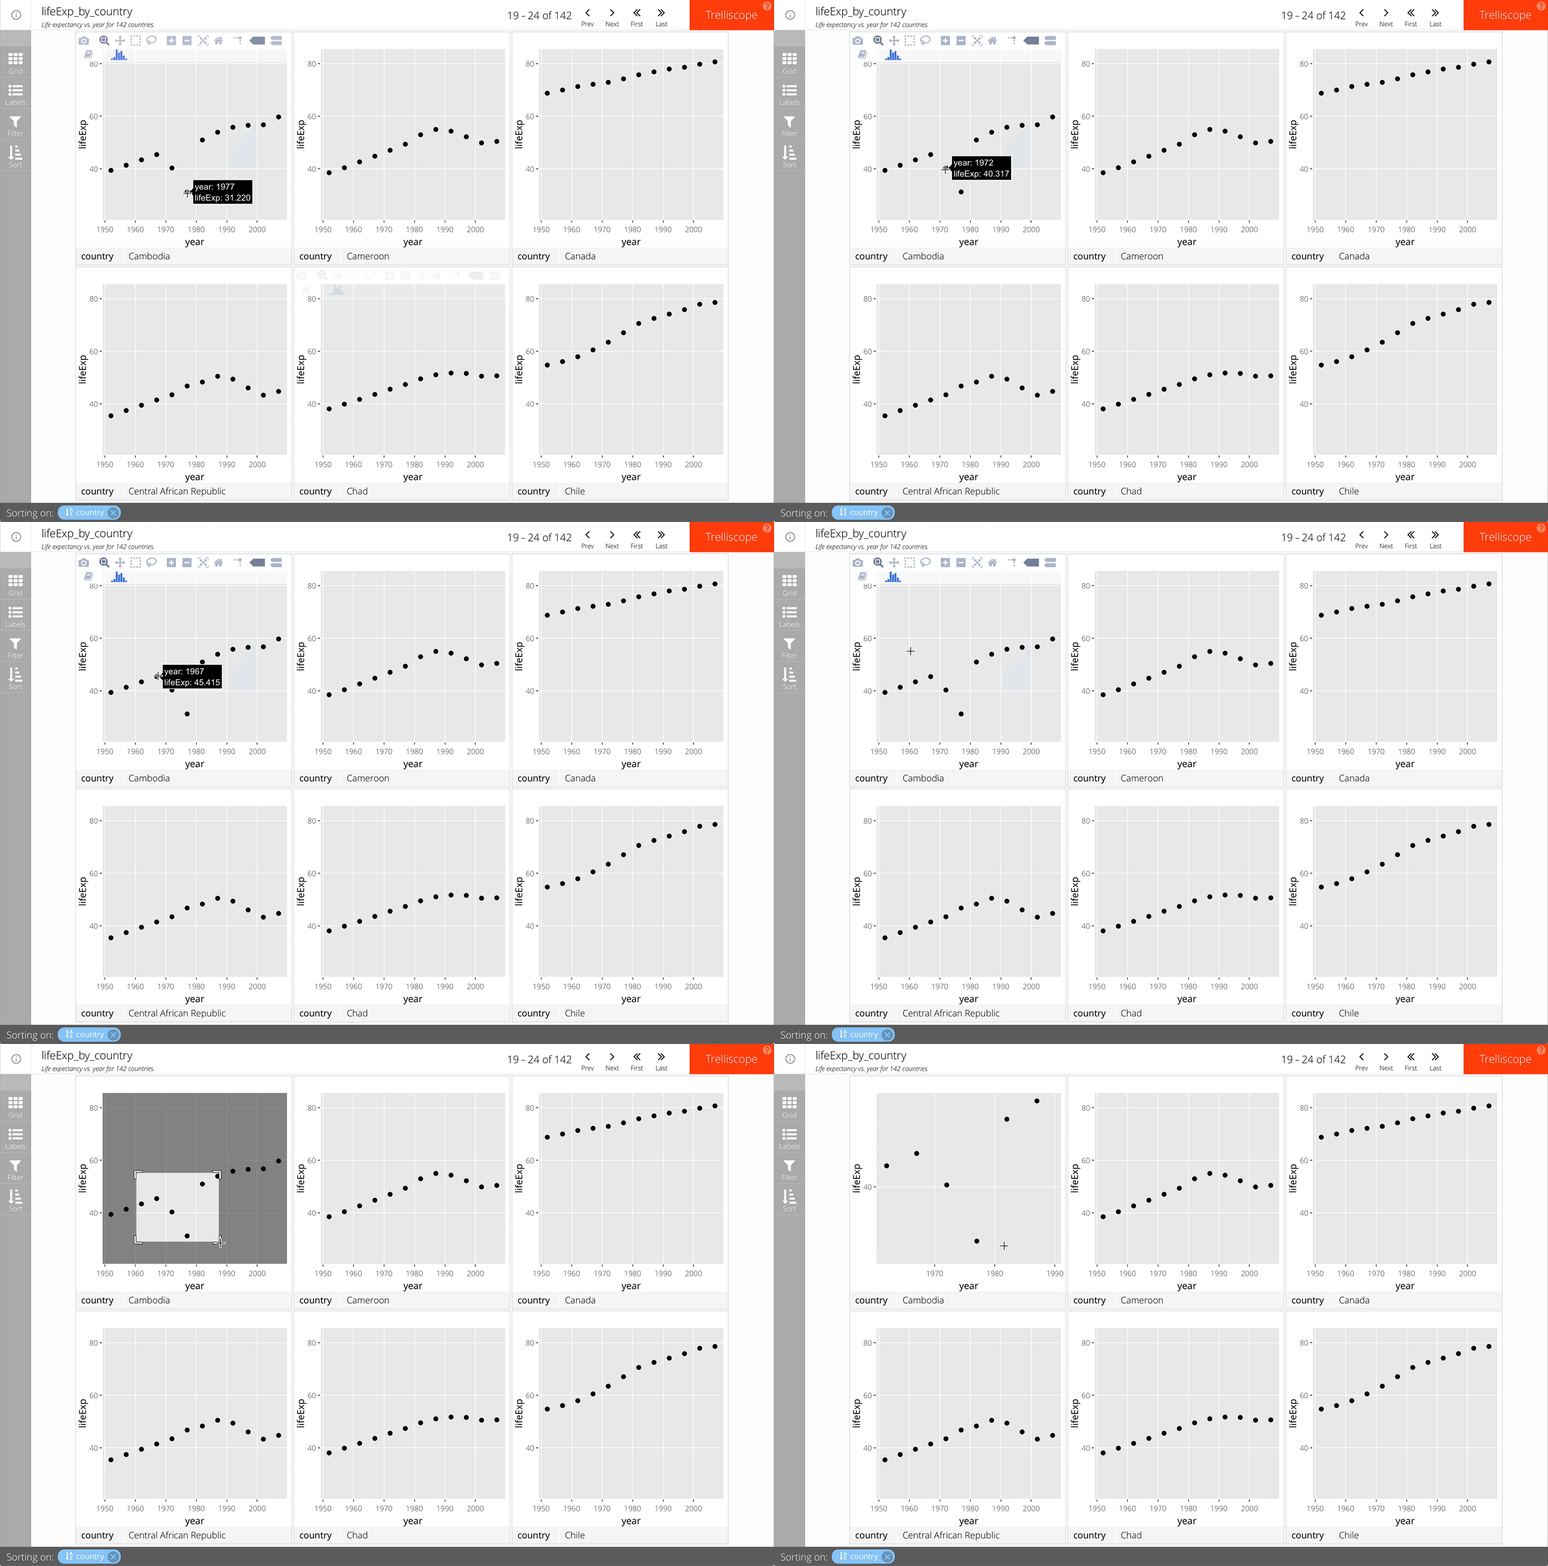
เพียงเพิ่ม as_plotly = TRUE ใน facet_trelliscope()

ตัวอย่างเช่น:

gap_life <- select(gapminder, year, lifeExp, country, continent)
ggplot(gap_life, aes(year, lifeExp)) +
  geom_point() +
  facet_trelliscope(~ country + continent,
    name = "lifeExp_by_country",
    desc = "Life expectancy vs. year for 142 countries.",
    nrow = 2, ncol = 3,
    as_plotly = TRUE)
การแสดงภาพข้อมูลขนาดใหญ่ด้วย Trelliscope ใน R

เพิ่ม Interactivity ให้แผงด้วย Plotly

การแสดงภาพข้อมูลขนาดใหญ่ด้วย Trelliscope ใน R

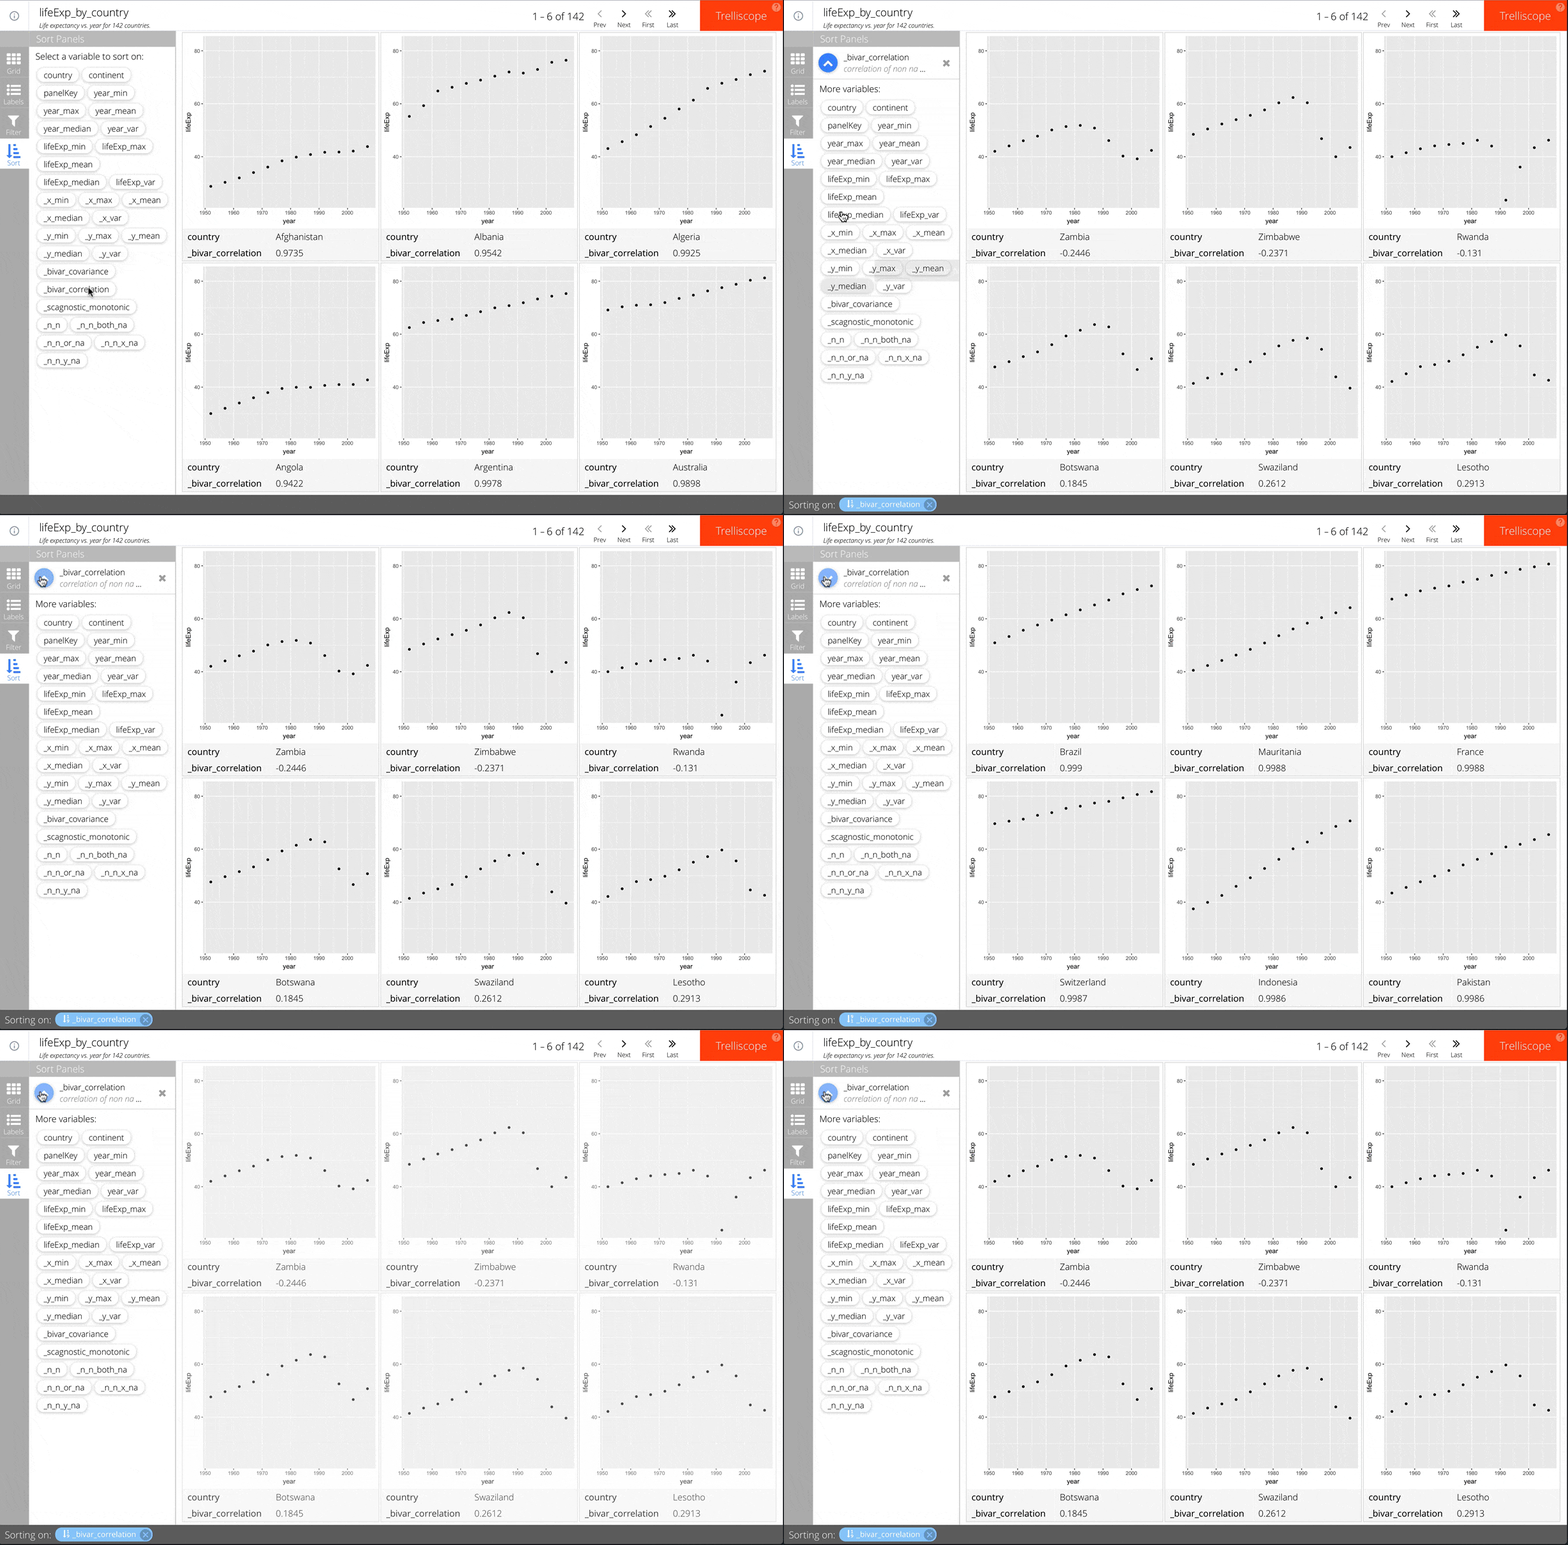
Cognostics อัตโนมัติตามบริบท

เพียงเพิ่ม auto_cog = TRUE ใน facet_trelliscope()

ตัวอย่างเช่น:

ggplot(gap_life, aes(year, lifeExp)) +
  geom_point() +
  facet_trelliscope(~ country + continent,
    name = "lifeExp_by_country",
    desc = "Life expectancy vs. year for 142 countries.",
    nrow = 2, ncol = 3,
    auto_cog = TRUE)

ดูข้อมูลเพิ่มเติมเกี่ยวกับ cognostics อัตโนมัติที่มีให้ใช้งานได้ที่ autocogs::autocog

การแสดงภาพข้อมูลขนาดใหญ่ด้วย Trelliscope ใน R

Cognostics อัตโนมัติตามบริบท

การแสดงภาพข้อมูลขนาดใหญ่ด้วย Trelliscope ใน R

ขอบเขตแกน

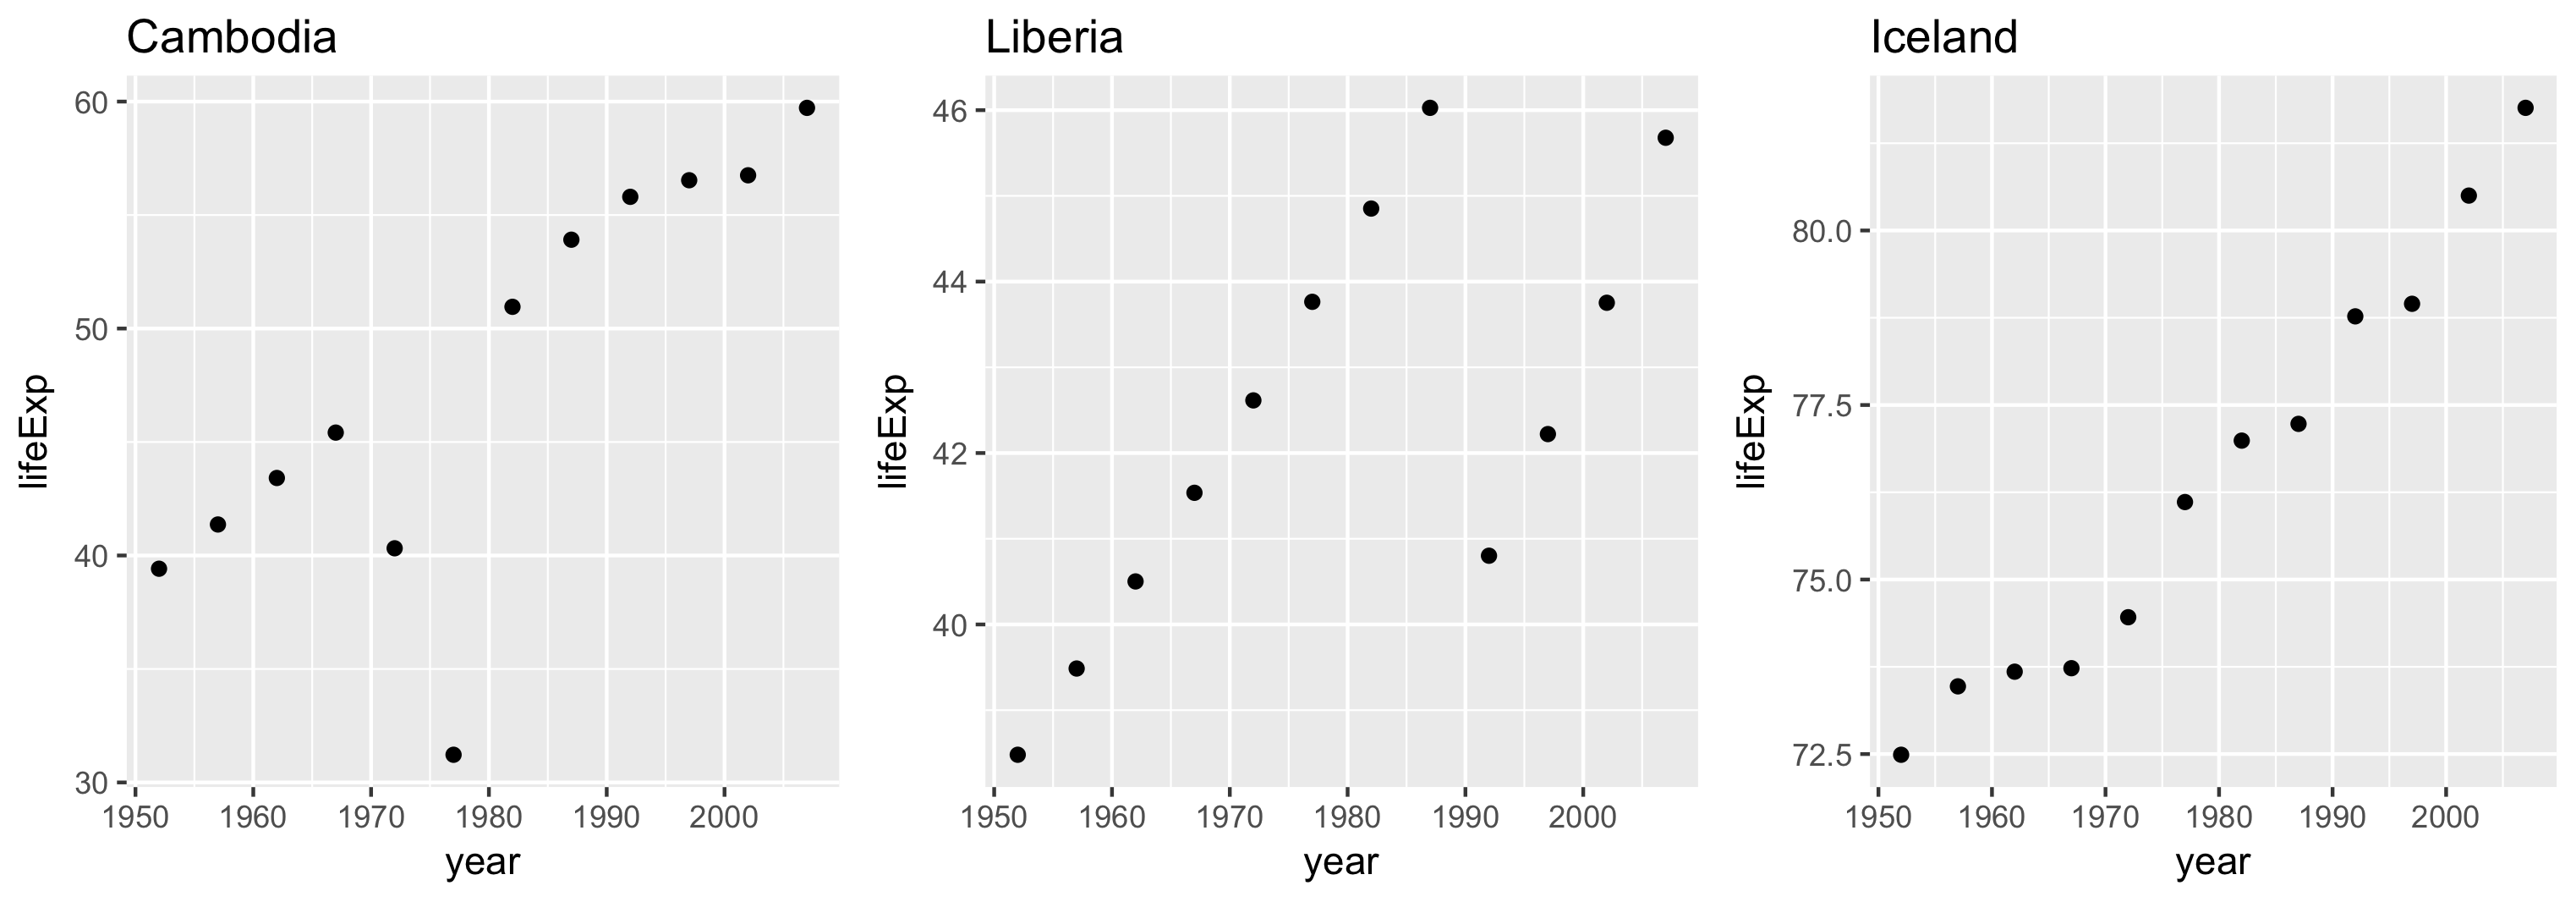
ควบคุมช่วงขอบเขตแกนด้วยอาร์กิวเมนต์ scales

มี 3 ตัวเลือก:

  • "same" (ค่าเริ่มต้น)
  • "sliced"
  • "free"
การแสดงภาพข้อมูลขนาดใหญ่ด้วย Trelliscope ใน R

scales = "same"

แต่ละแผงมีขอบเขตเหมือนกัน

ช่วยให้เปรียบเทียบข้ามแผงได้อย่างเที่ยงตรง
การแสดงภาพข้อมูลขนาดใหญ่ด้วย Trelliscope ใน R

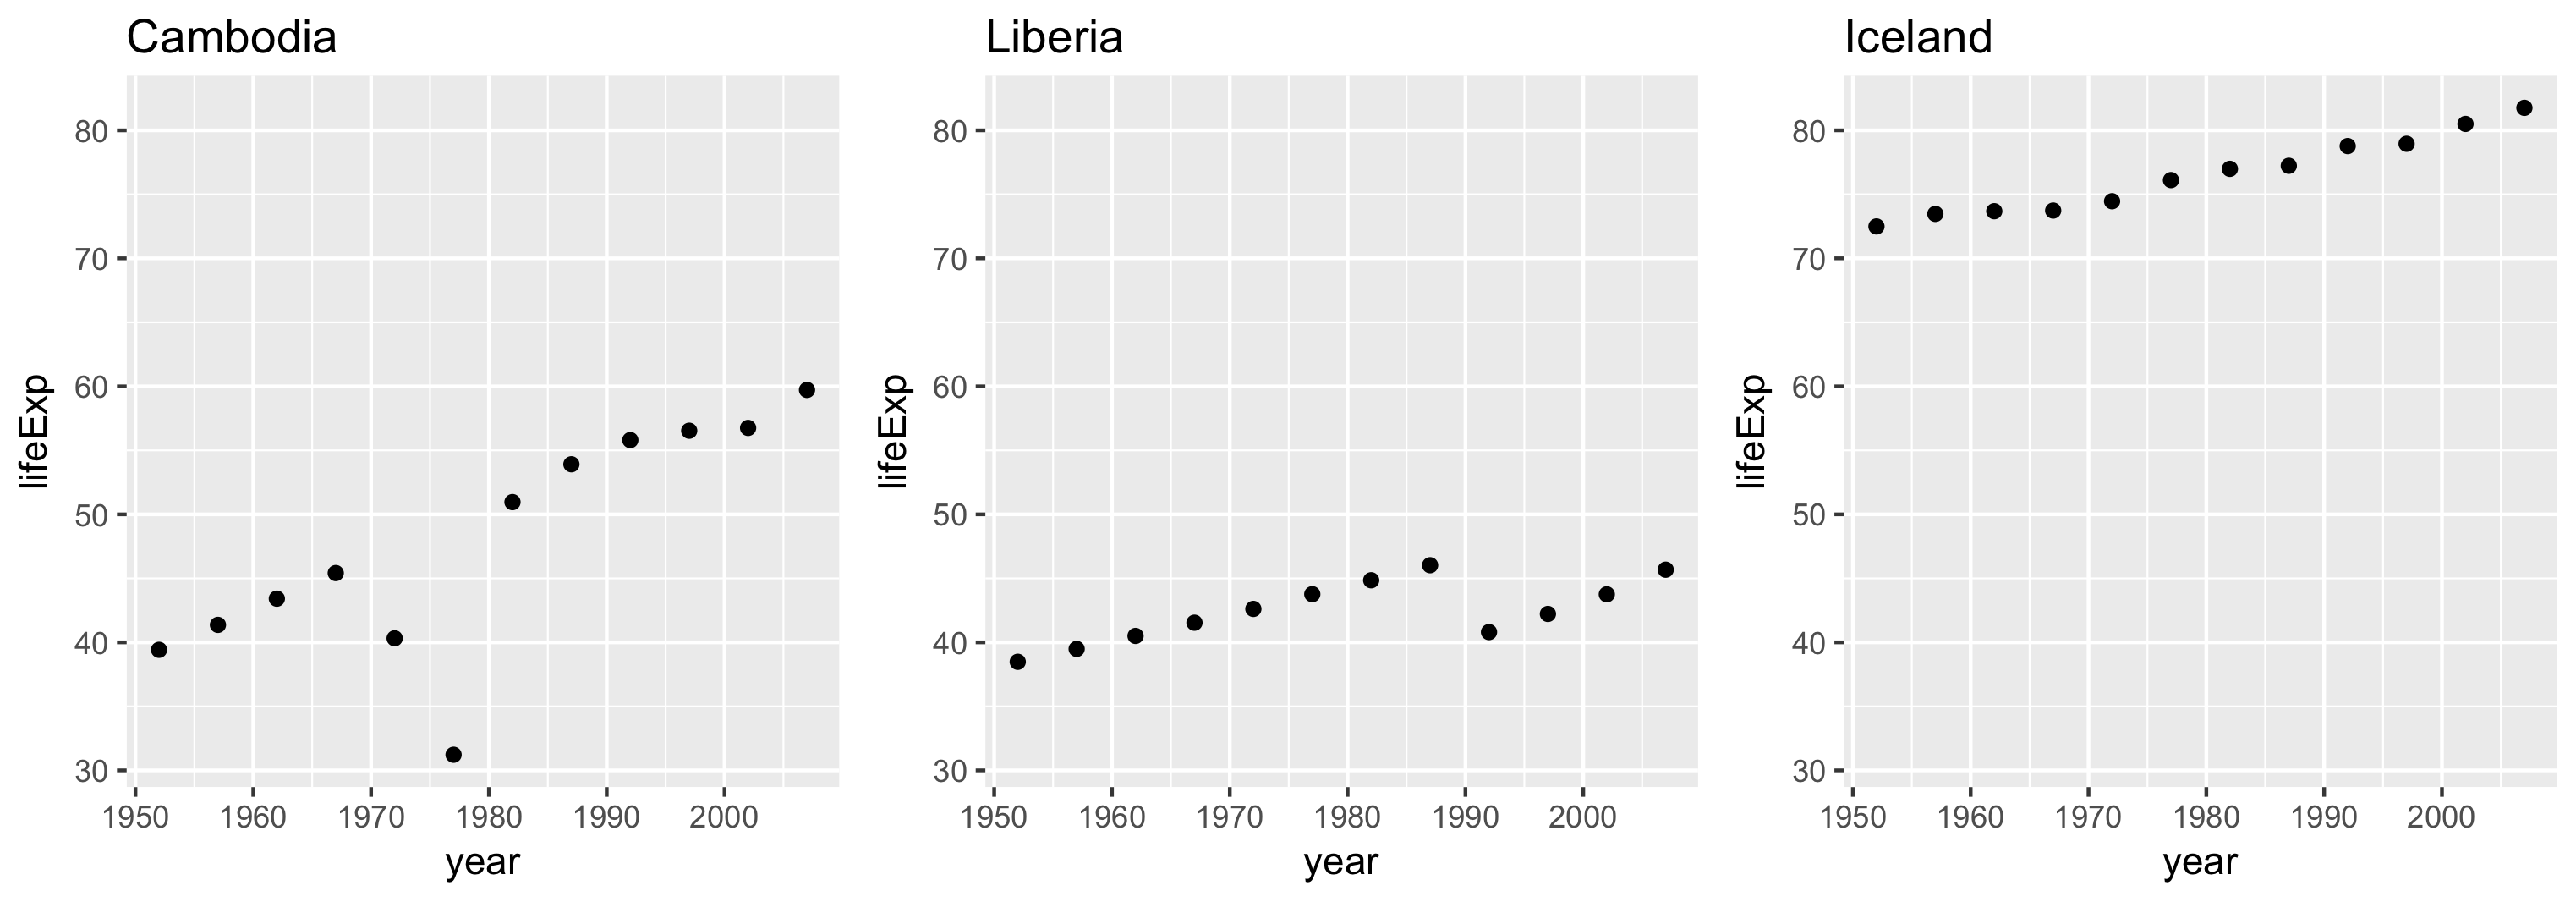
scales = "sliced"

แต่ละแผงมีช่วงขอบเขตเท่ากัน แต่จุดเริ่มต้นอาจต่างกัน

เหมาะสำหรับเปรียบเทียบความแตกต่างของสเกล
การแสดงภาพข้อมูลขนาดใหญ่ด้วย Trelliscope ใน R

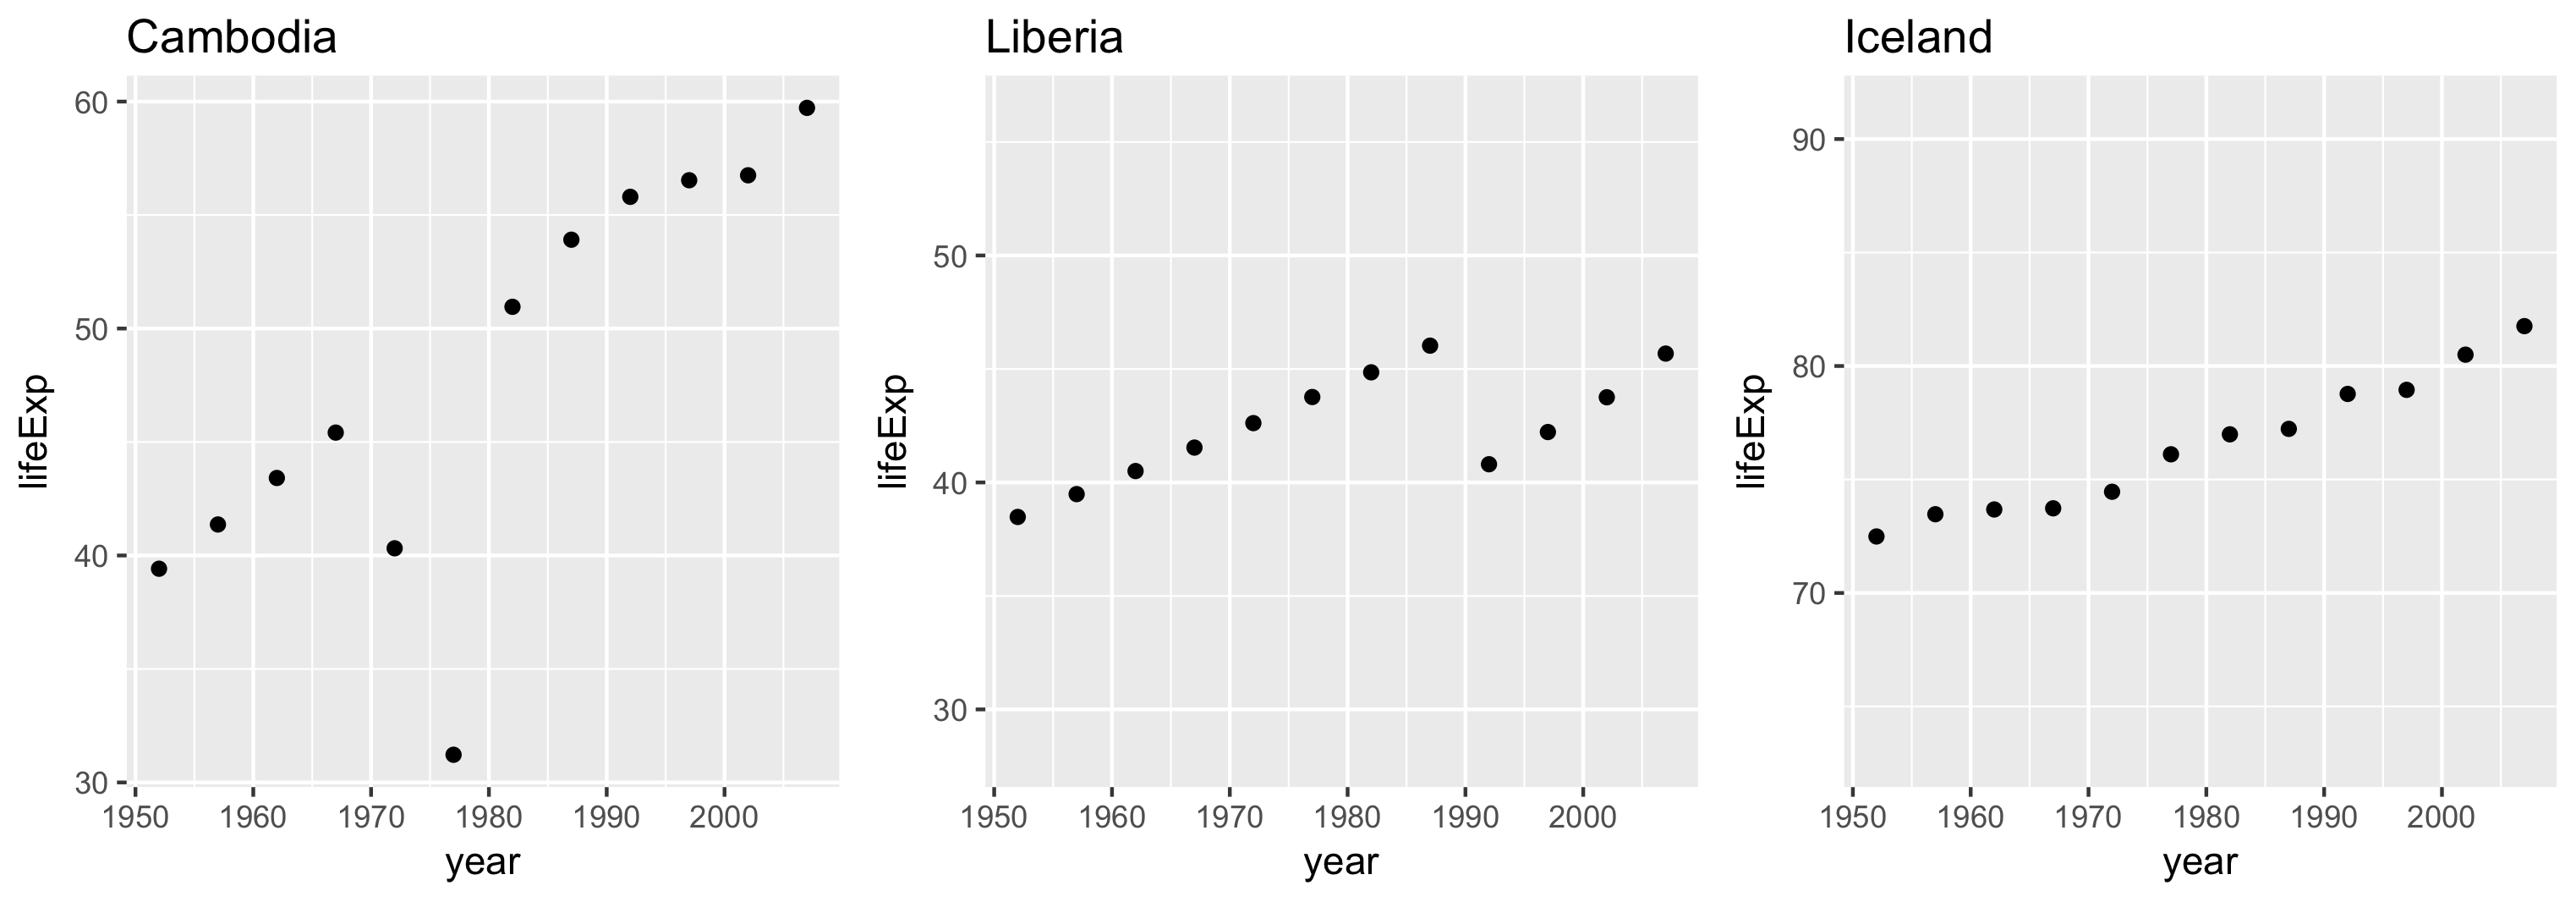
scales = "free"

แต่ละแผงมีขอบเขตตามช่วงข้อมูลของตัวเอง
การแสดงภาพข้อมูลขนาดใหญ่ด้วย Trelliscope ใน R

มาฝึกกันเถอะ!

การแสดงภาพข้อมูลขนาดใหญ่ด้วย Trelliscope ใน R

Preparing Video For Download...