Faceting กับ TrelliscopeJS

การแสดงภาพข้อมูลขนาดใหญ่ด้วย Trelliscope ใน R

Ryan Hafen

Author, TrelliscopeJS

Faceting กับ TrelliscopeJS
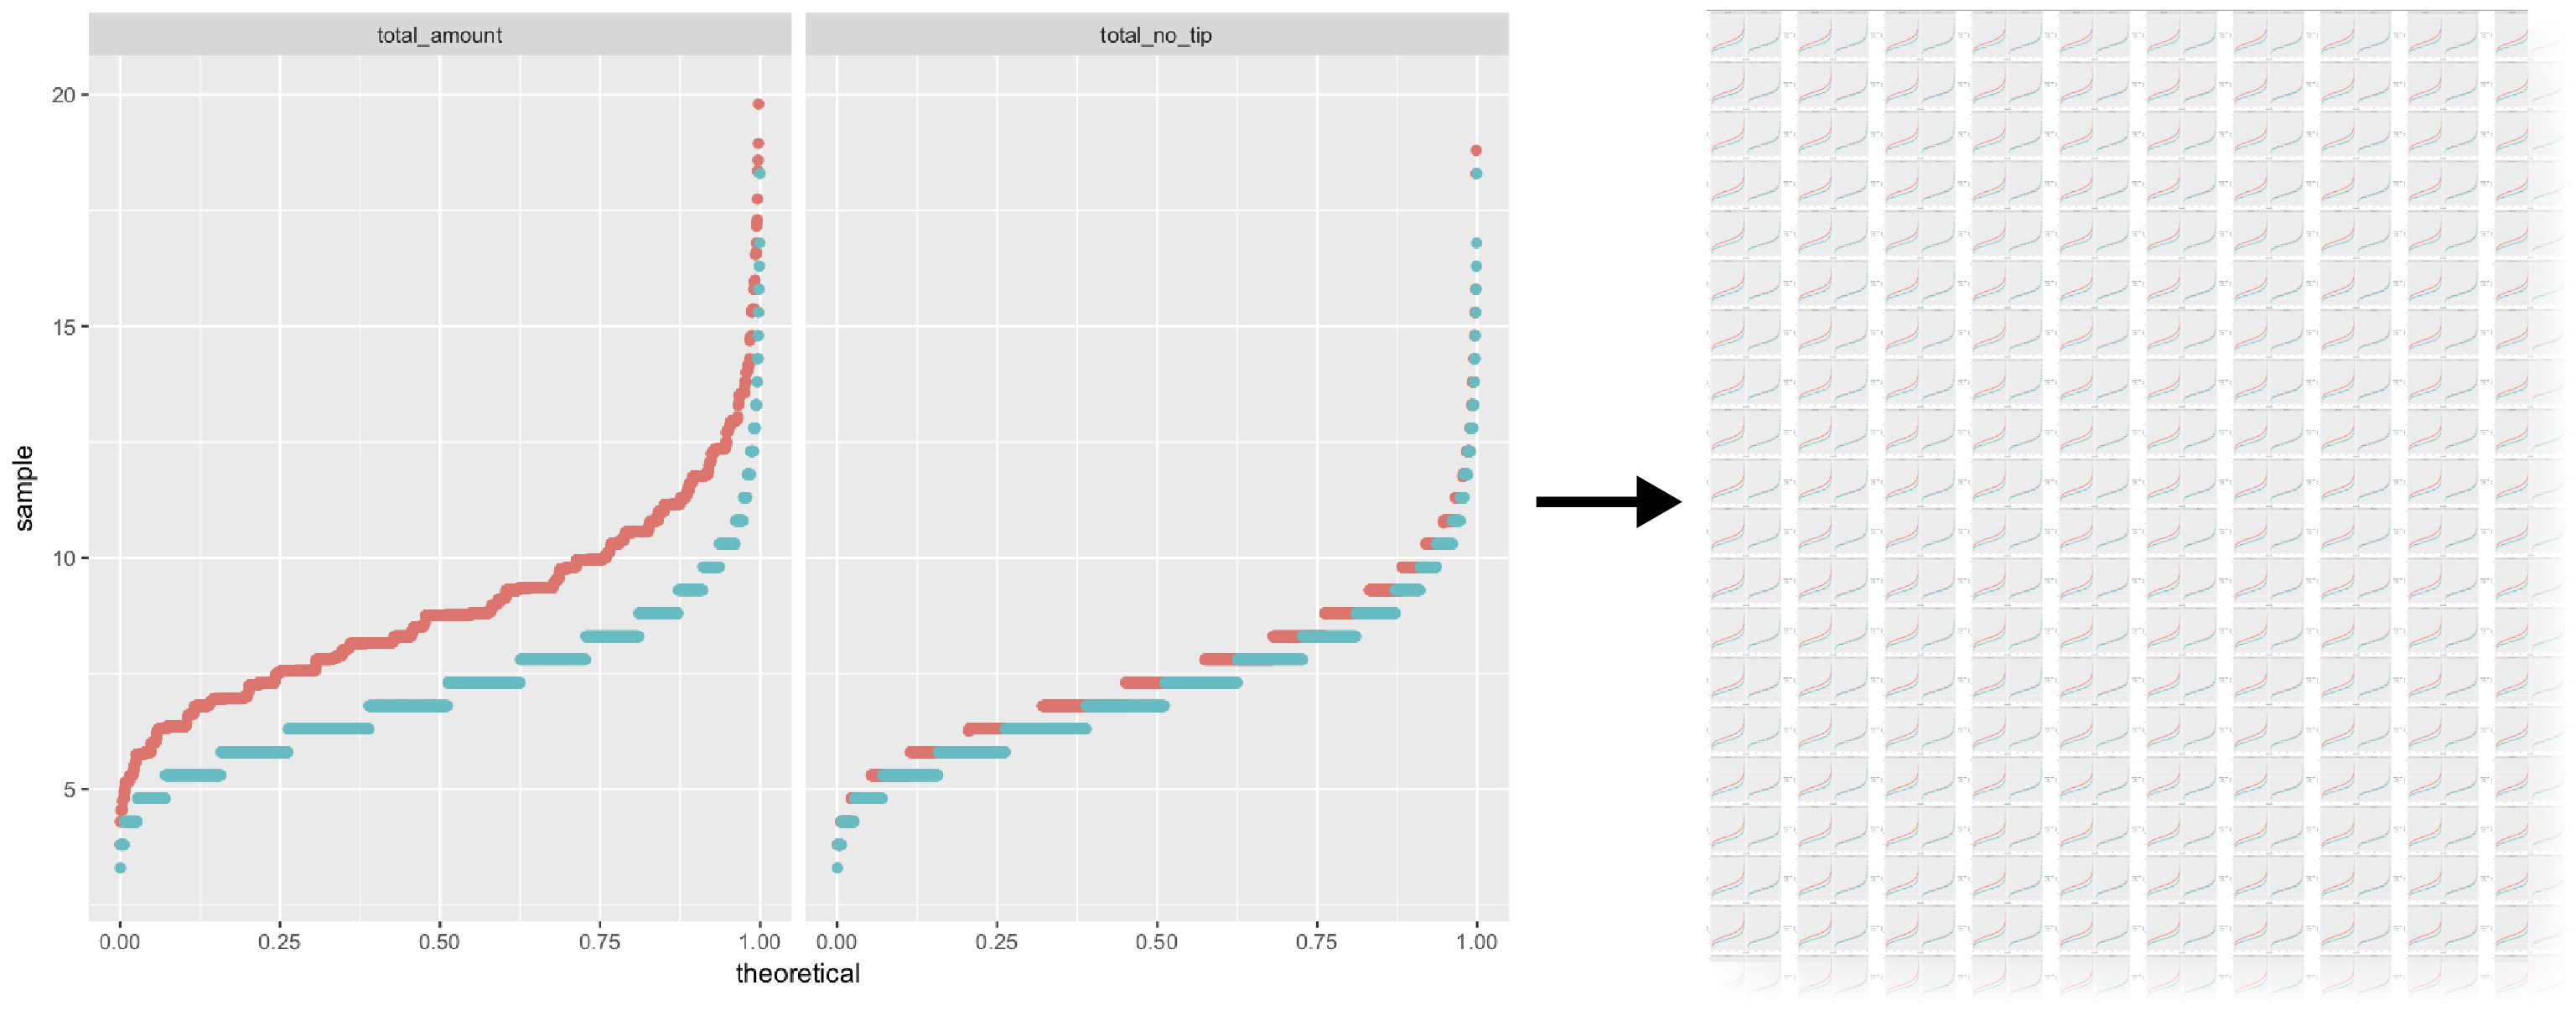
การแสดงภาพข้อมูลขนาดใหญ่ด้วย Trelliscope ใน R

ข้อมูล Gapminder

library(gapminder)
head(gapminder)
# A tibble: 6 x 6
  country     continent  year lifeExp      pop gdpPercap
  <fct>       <fct>     <int>   <dbl>    <int>     <dbl>
1 Afghanistan Asia       1952    28.8  8425333       779
2 Afghanistan Asia       1957    30.3  9240934       821
3 Afghanistan Asia       1962    32.0 10267083       853
4 Afghanistan Asia       1967    34.0 11537966       836
5 Afghanistan Asia       1972    36.1 13079460       740
6 Afghanistan Asia       1977    38.4 14880372       786
การแสดงภาพข้อมูลขนาดใหญ่ด้วย Trelliscope ใน R

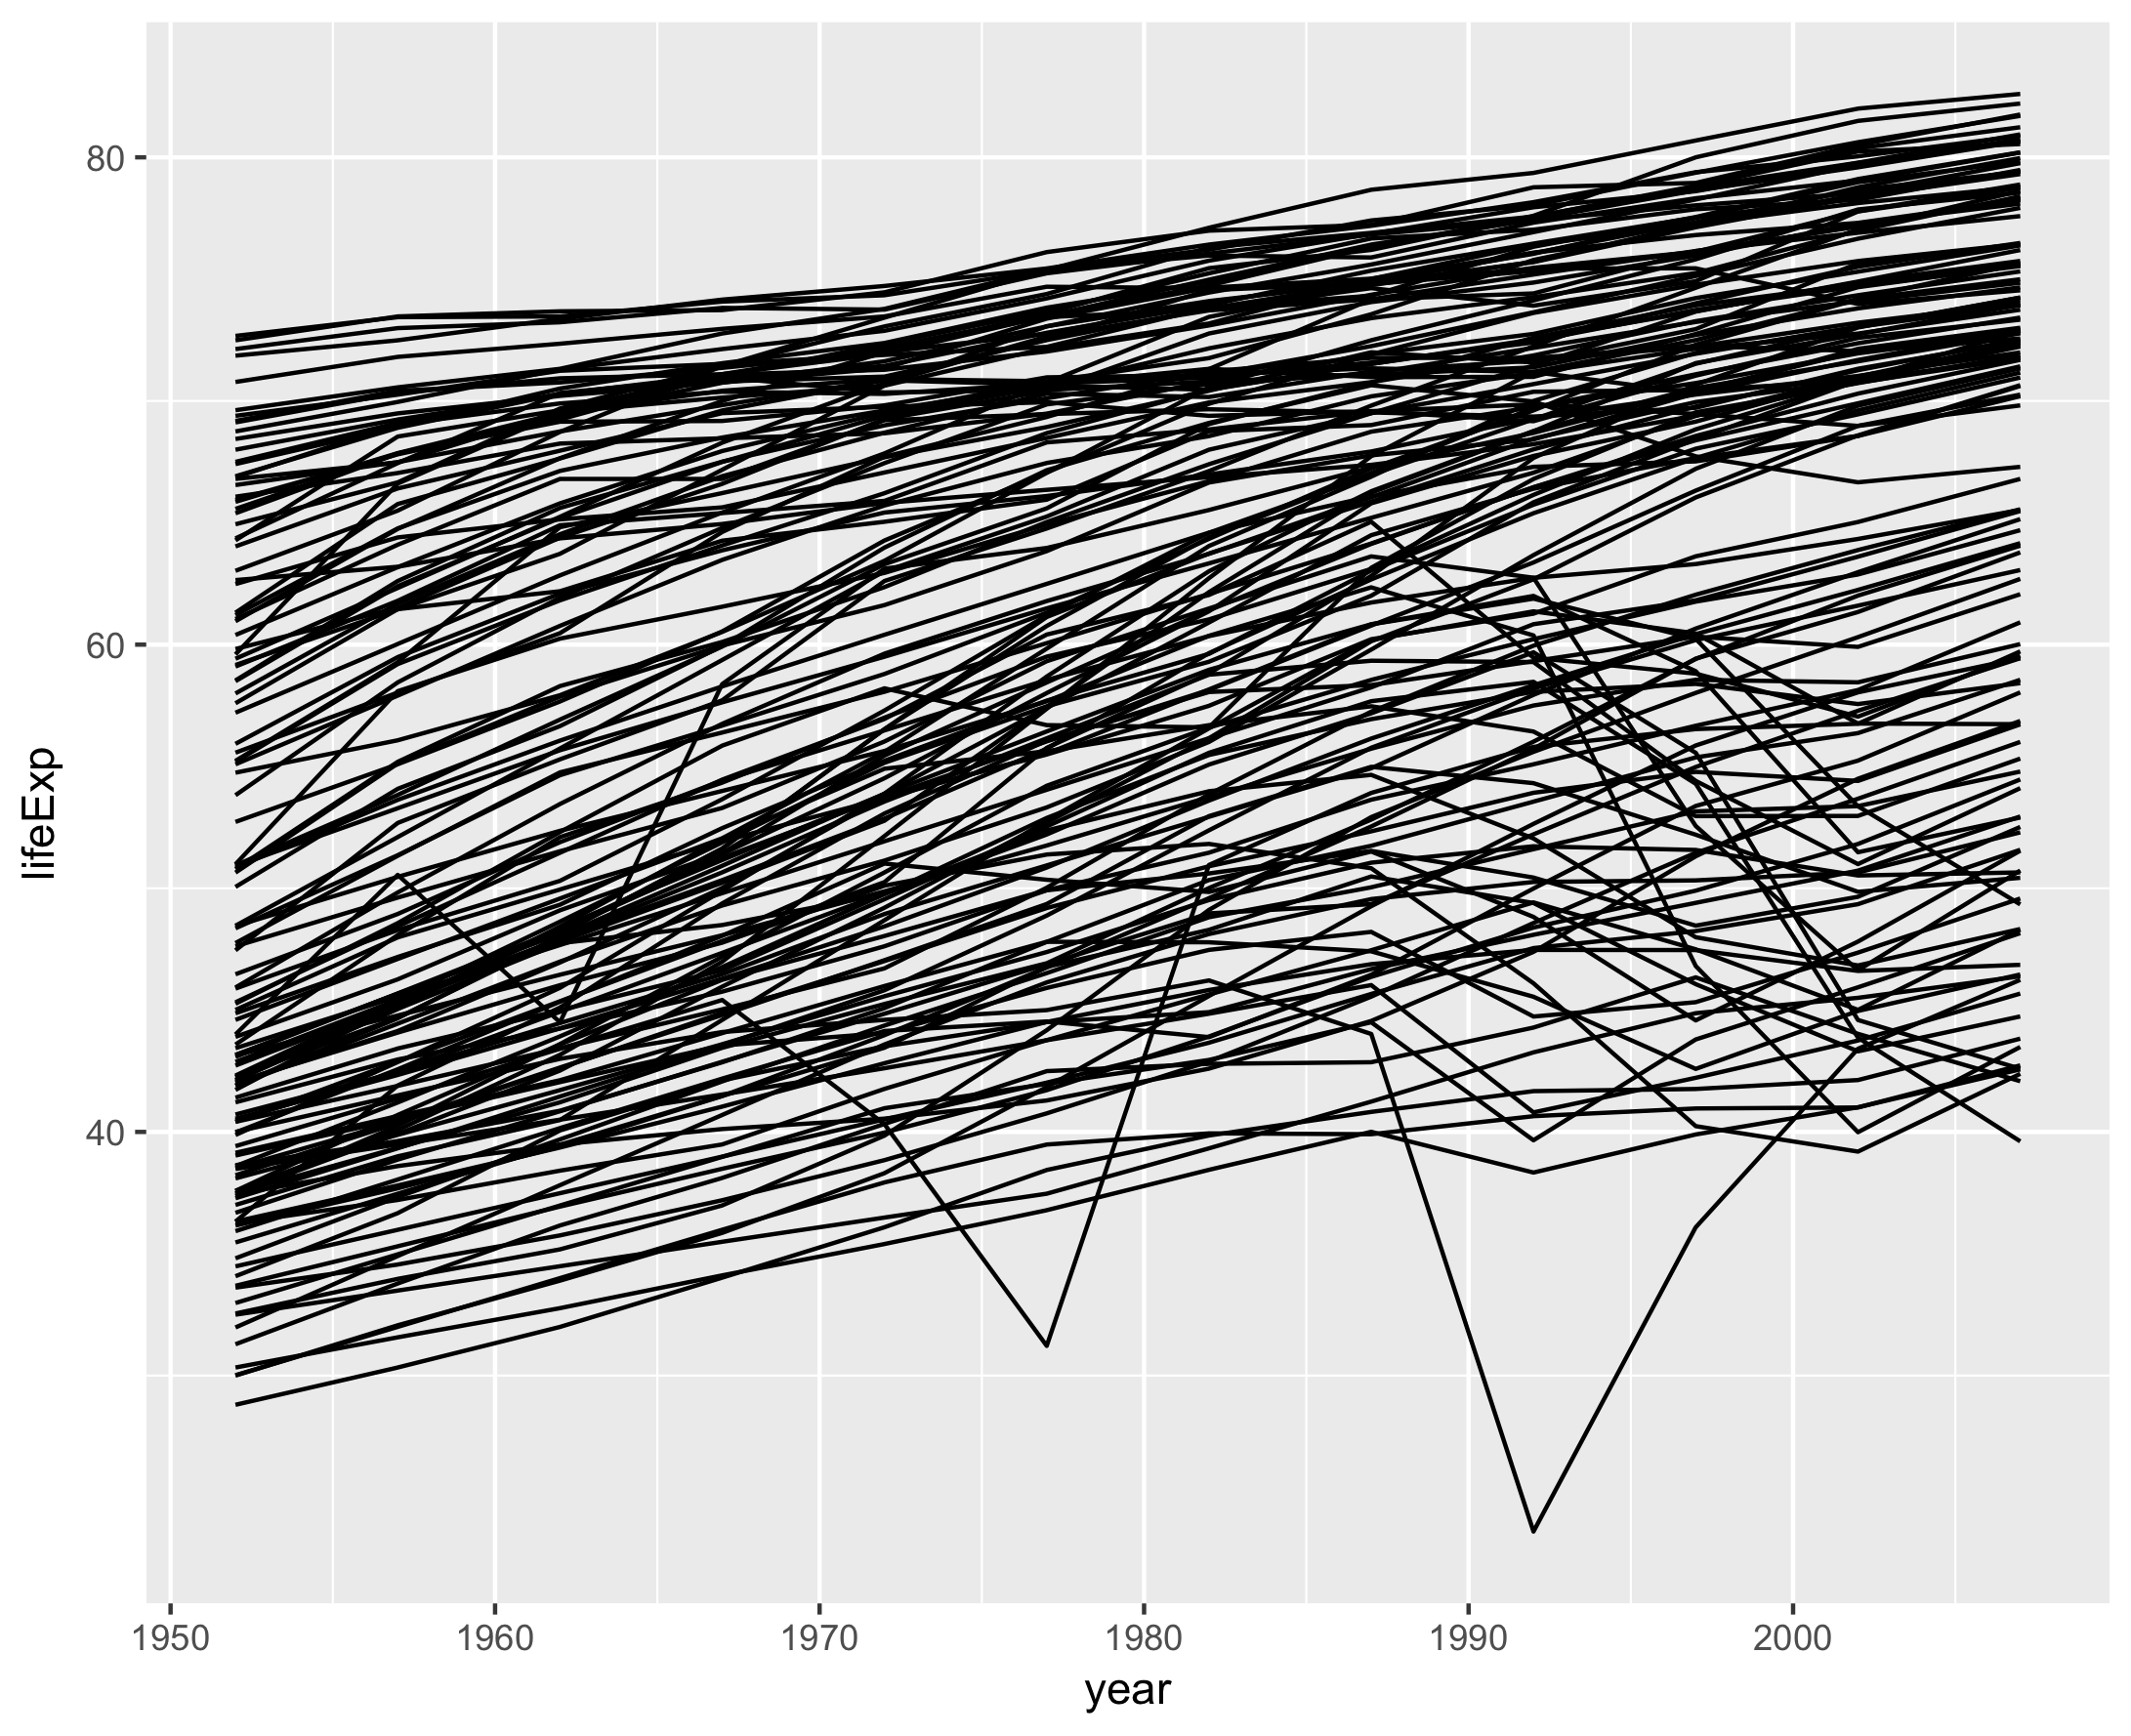
อายุขัยเฉลี่ยตามเวลาของแต่ละประเทศ

ggplot(gapminder, aes(year, lifeExp, group = country)) +
  geom_line()
การแสดงภาพข้อมูลขนาดใหญ่ด้วย Trelliscope ใน R

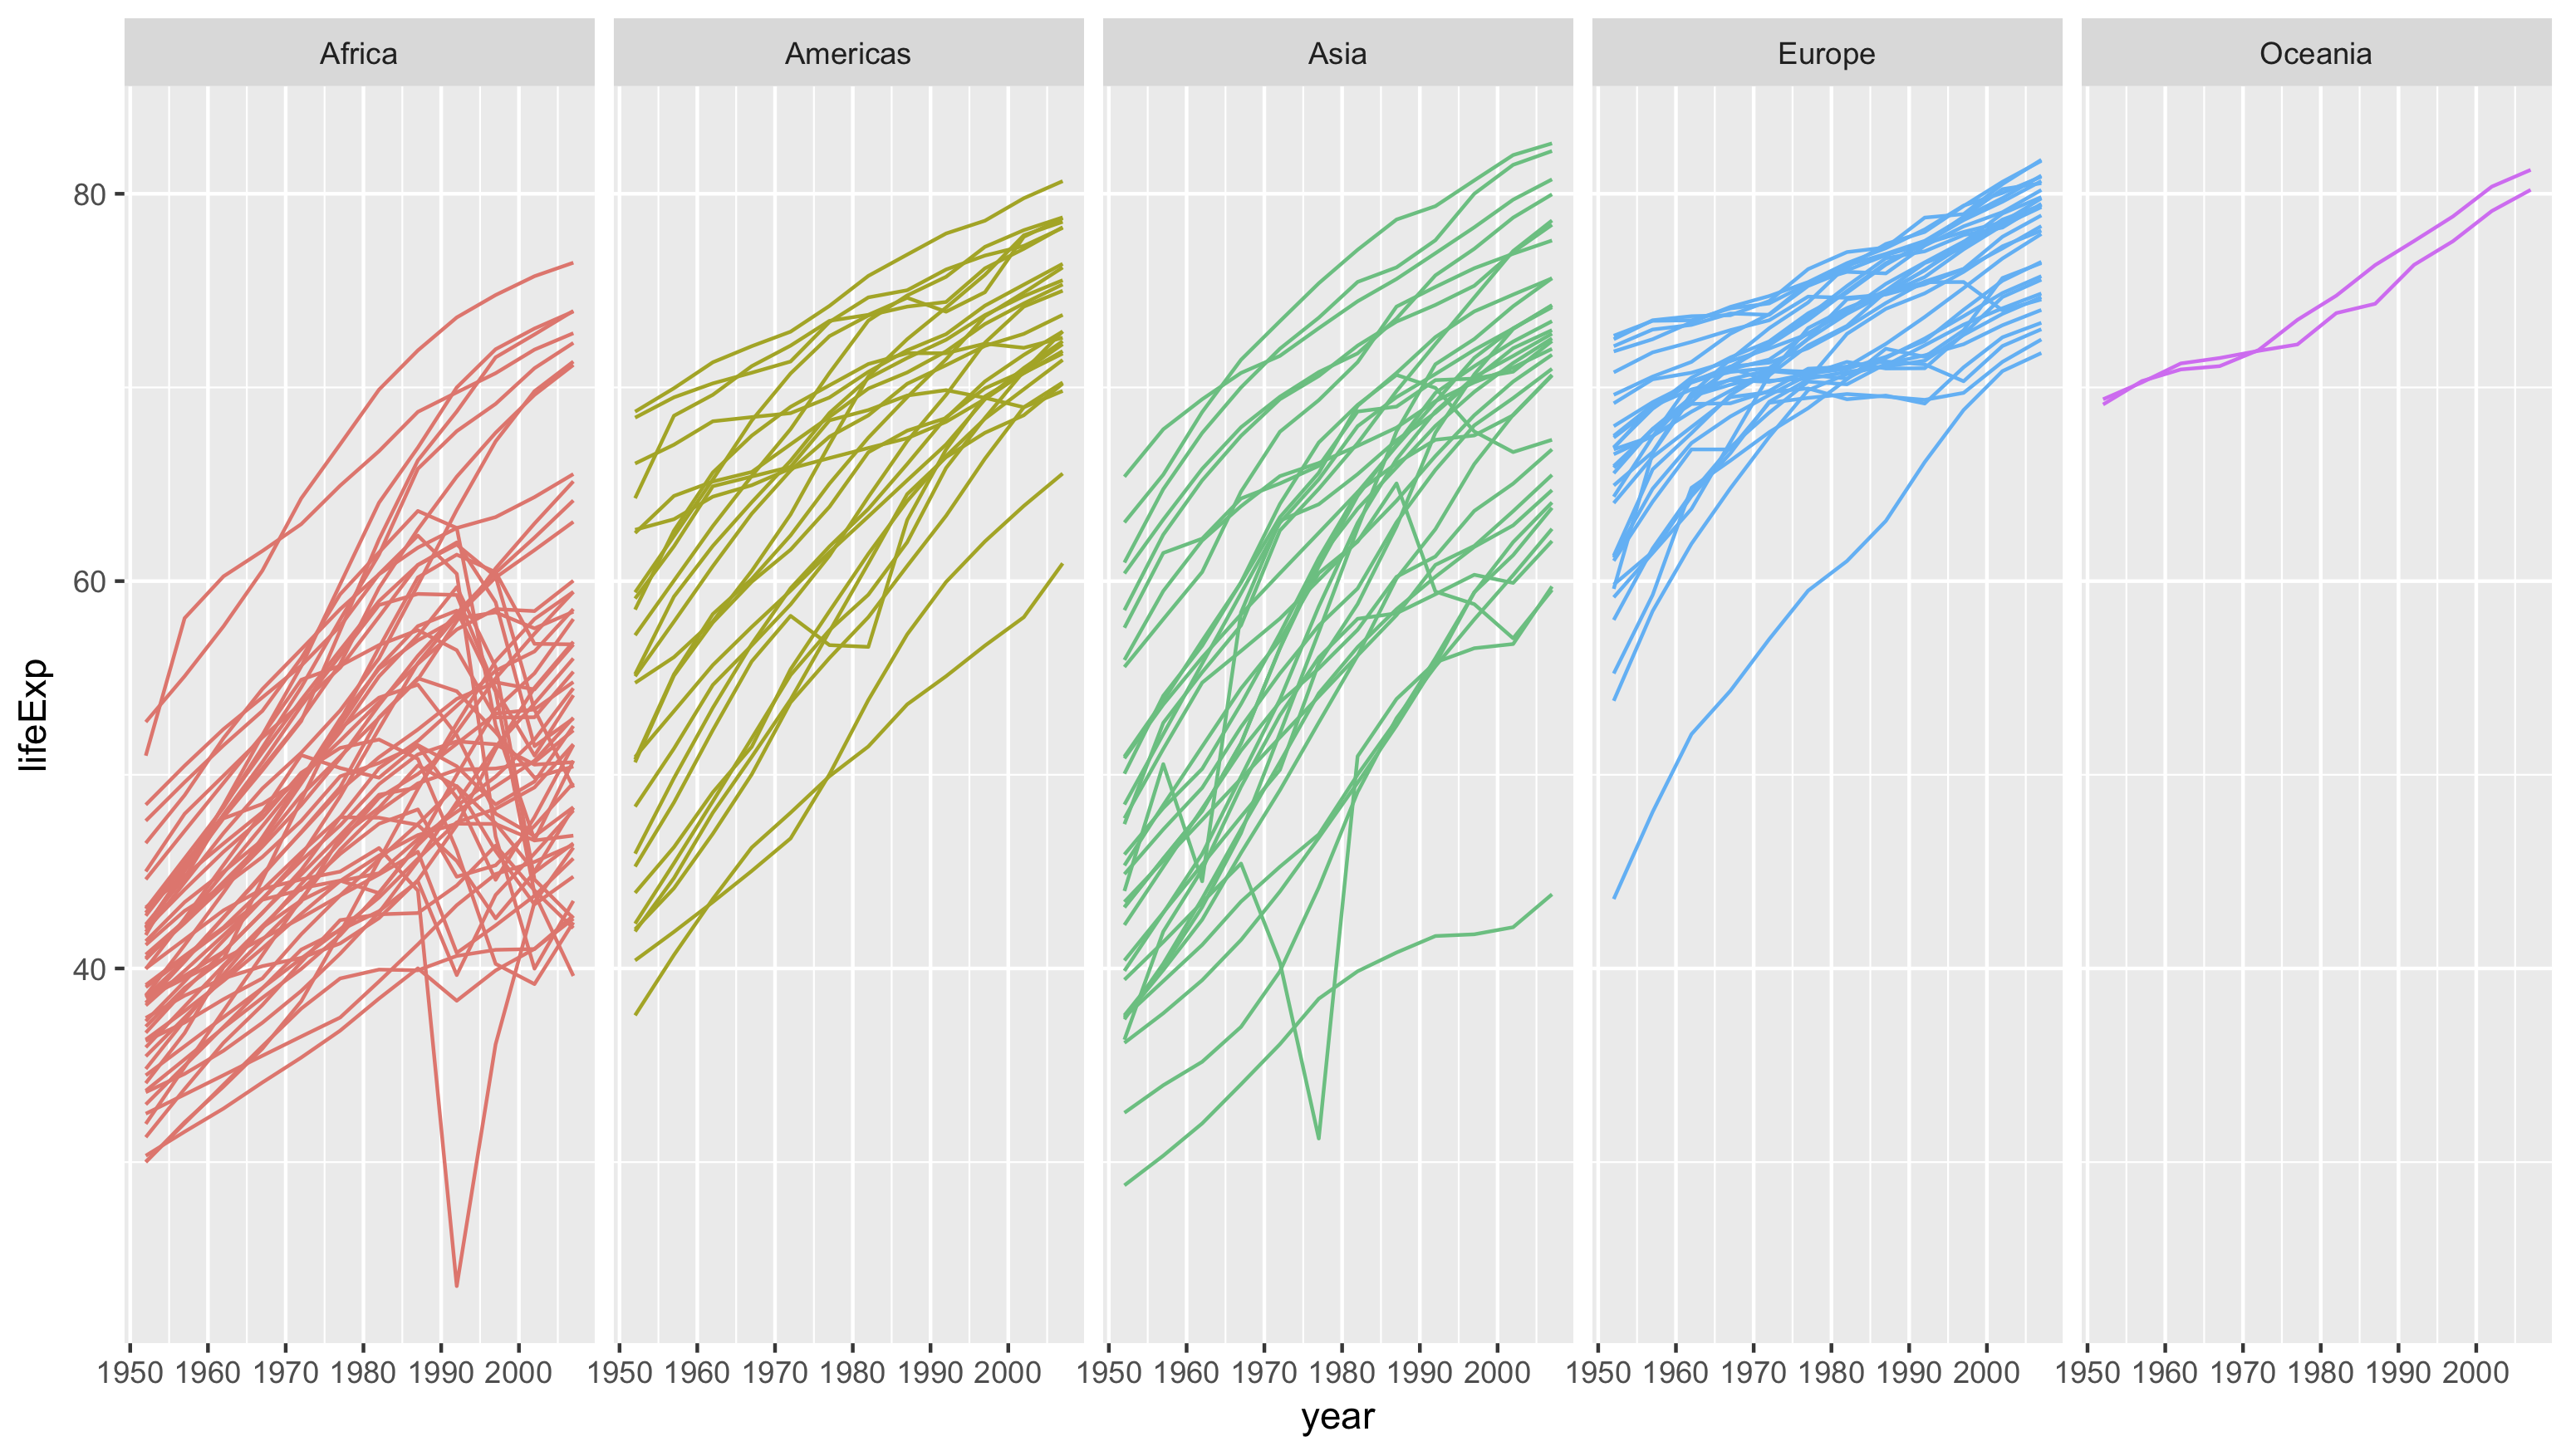
Faceting ตามทวีป

ggplot(gapminder, aes(year, lifeExp, group = country, color = continent)) +
  geom_line() +
  facet_wrap(~ continent, nrow = 1) +
  guides(color = FALSE)
การแสดงภาพข้อมูลขนาดใหญ่ด้วย Trelliscope ใน R

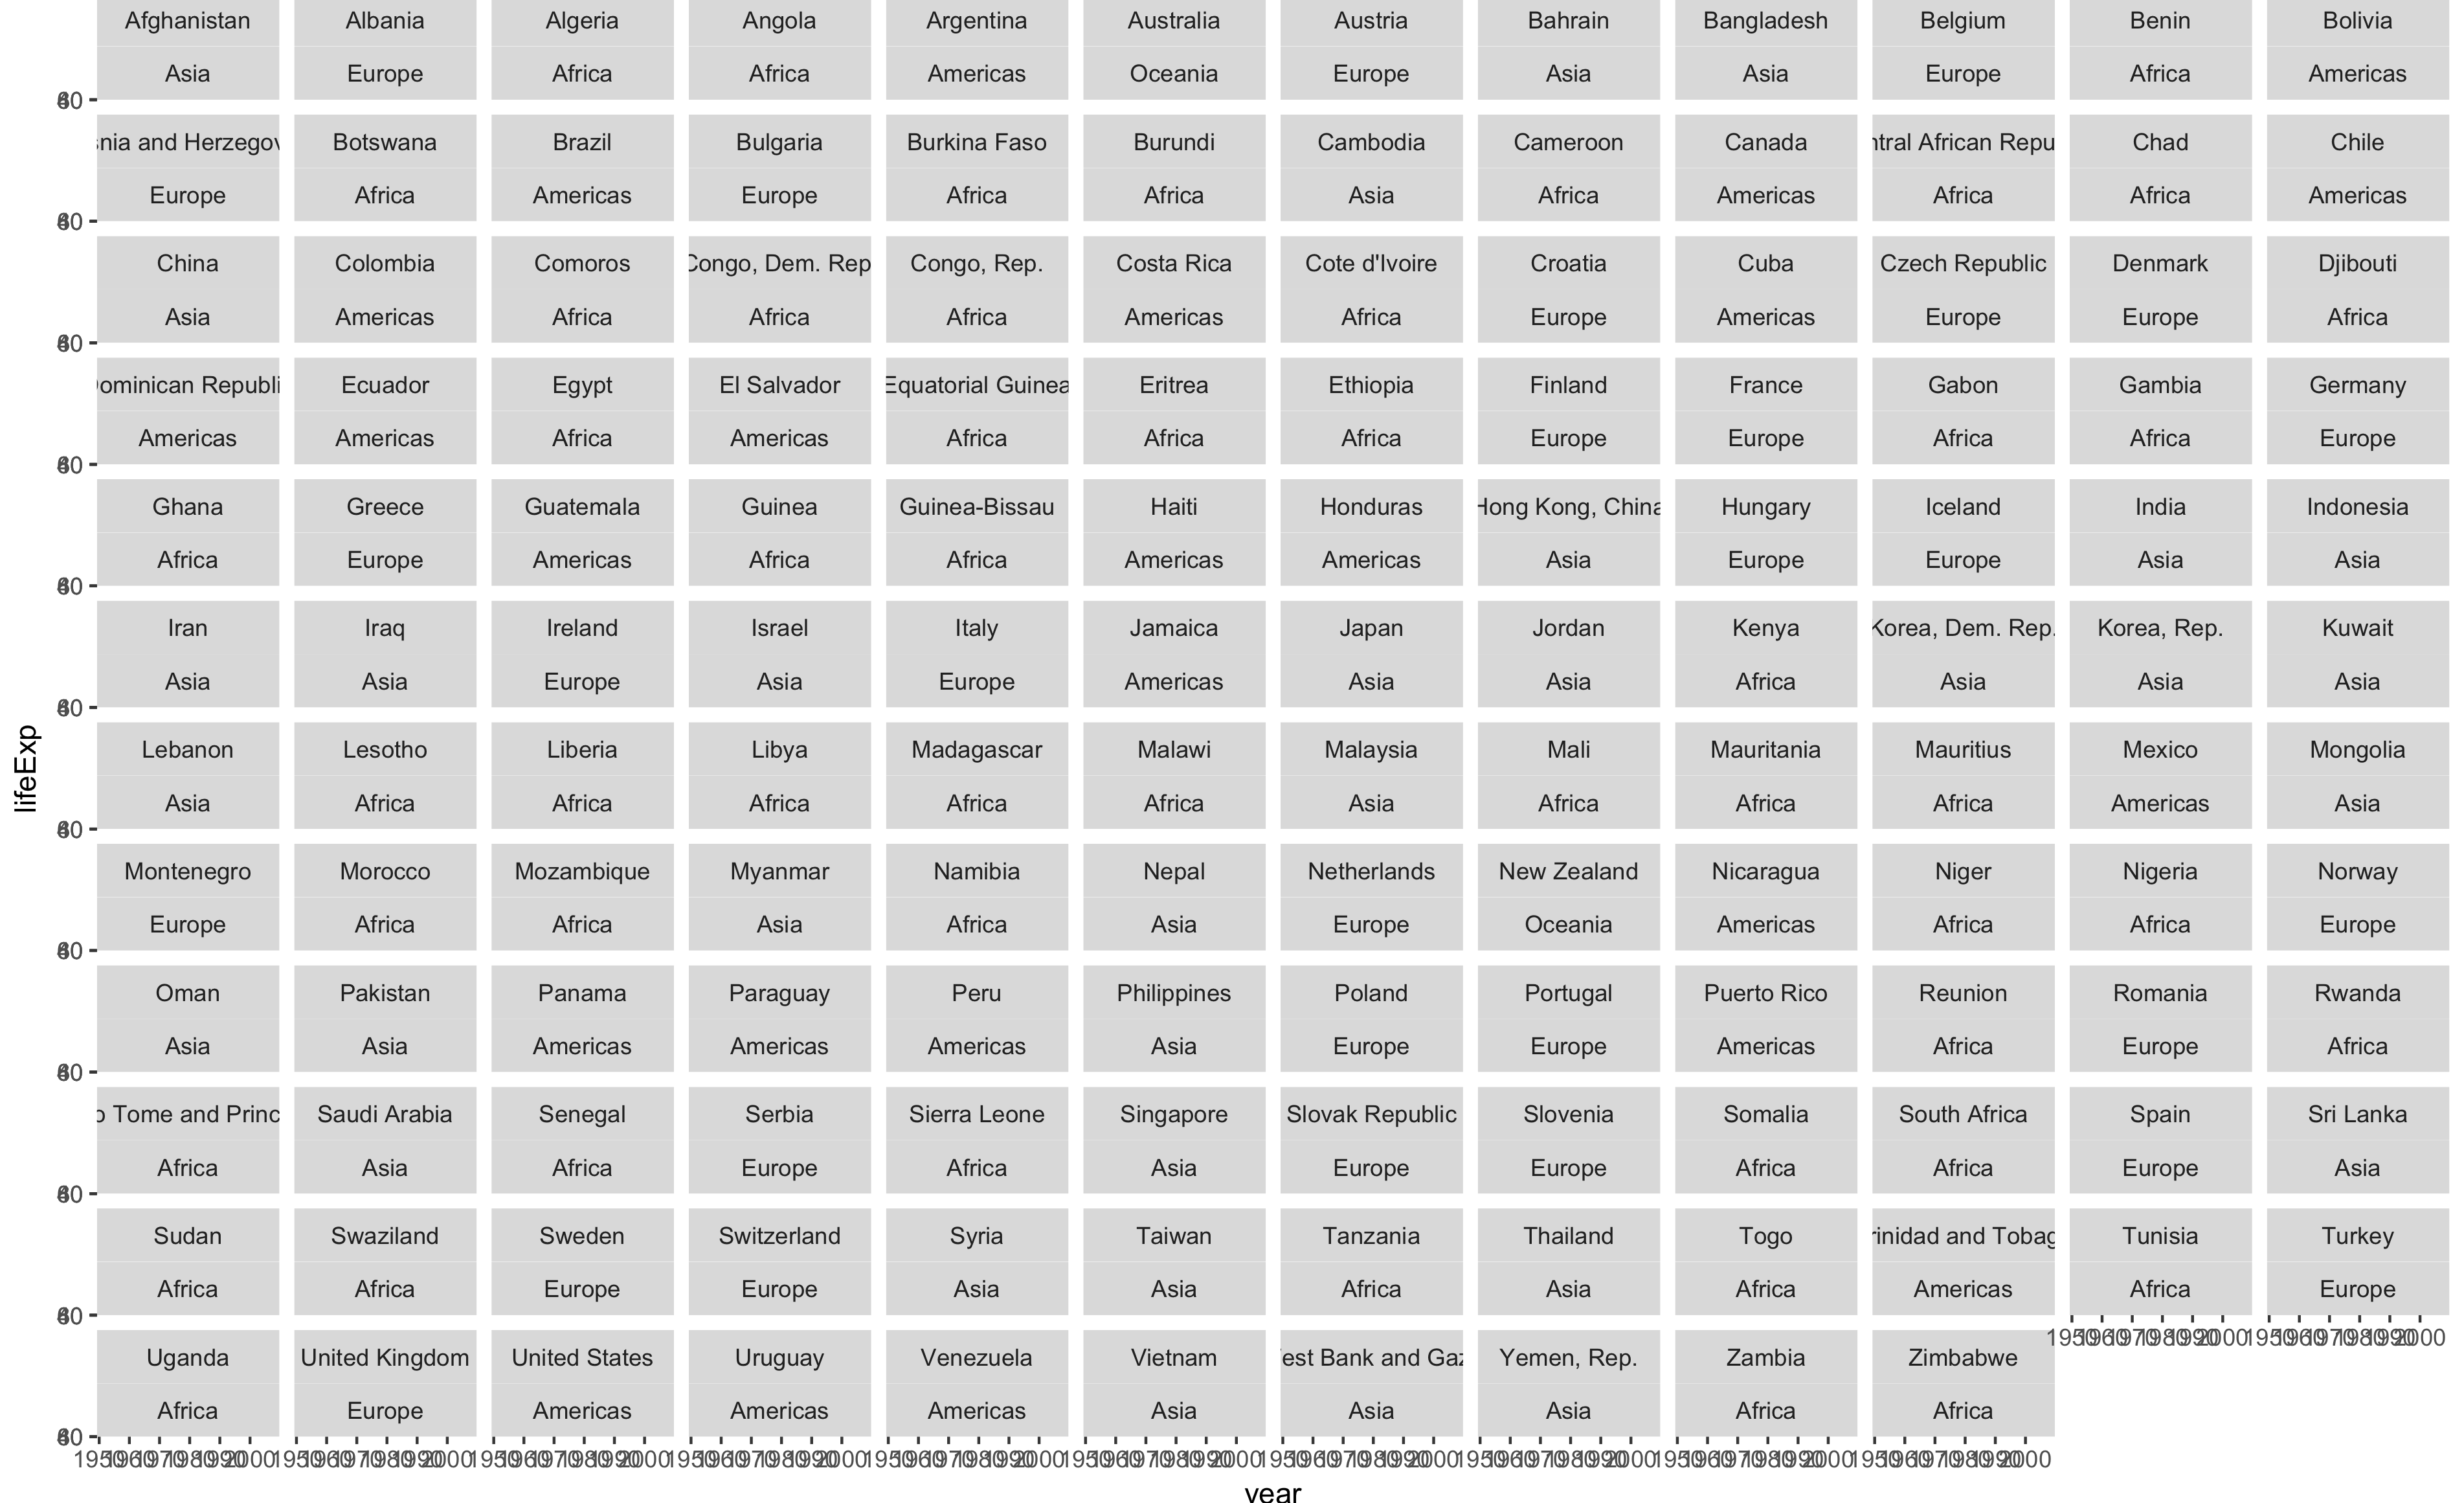
Faceting ตามประเทศ

ggplot(gapminder, aes(year, lifeExp)) +
  geom_line() +
  facet_wrap(~ country + continent)
การแสดงภาพข้อมูลขนาดใหญ่ด้วย Trelliscope ใน R

Faceting กับ TrelliscopeJS

แค่เปลี่ยนจาก facet_wrap() เป็น facet_trelliscope() เท่านั้น

เช่นเดียวกับ facet_wrap() ควบคุมแถวและคอลัมน์ด้วย nrow และ ncol

ตัวเลือกเพิ่มเติม:

  • กำหนดเลย์เอาต์ด้วย nrow และ ncol คล้ายกับ facet_wrap()
  • ตั้งชื่อ (name) และคำอธิบาย (desc) ของการแสดงผล
  • กำหนดตำแหน่งบันทึกผลด้วย path
การแสดงภาพข้อมูลขนาดใหญ่ด้วย Trelliscope ใน R

มาฝึกกันเถอะ!

การแสดงภาพข้อมูลขนาดใหญ่ด้วย Trelliscope ใน R

Preparing Video For Download...