Аналітика бізнес-процесів в R
Gert Janssenswillen
Creator of bupaR

Оцінюємо охоплення журналу подій
library(bupaR)
Цю інформацію можна побачити, вивівши підсумок журналу подій
summary(learning)
або використавши функції підрахунку.
n_cases(learning)
498
n_activities(learning)
10
Дії описують перебіг процесу
activity_labels(learning)
[1] "Consult Dictionary" "Consult Theory Pages" "Exercise 1"
[4] "Exercise 2" "Exercise 3" "Exercise 4"
[7] "Exercise 5" "Exercise 6" "Exercise 7"
[10] "Assessment"
activities(learning)
# A tibble: 10 x 3
action absolute_frequency relative_frequency
<chr> <dbl> <dbl>
1 Exercise 1 516 0.142
2 Assessment 498 0.137
3 Exercise 2 493 0.135
4 Exercise 4 442 0.121
5 Exercise 3 436 0.120
6 Exercise 5 360 0.0988
7 Exercise 6 302 0.0829
8 Exercise 7 299 0.0820
9 Consult Dictionary 165 0.0453
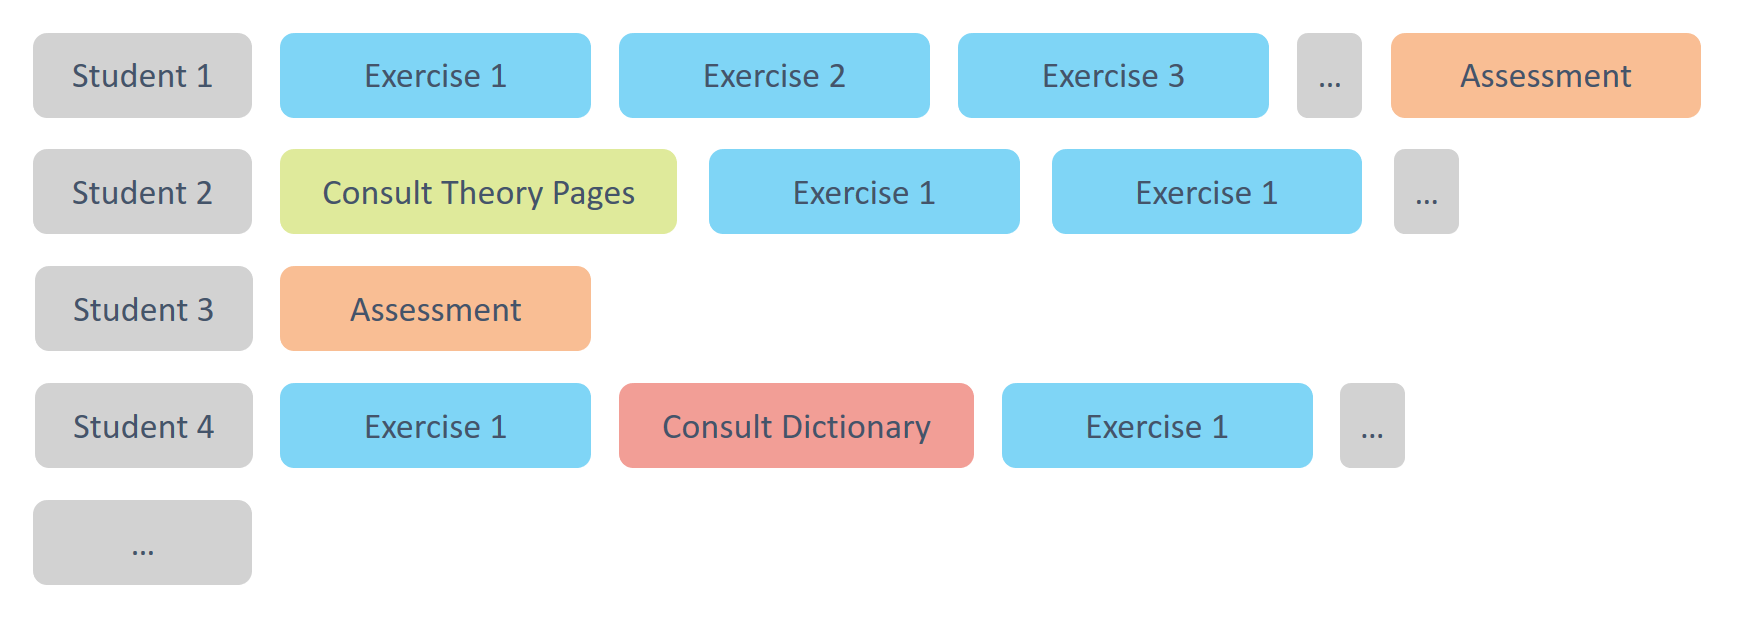
Кожен кейс описано послідовністю дій — його трейсом.
tracestraces(learning)
trace_explorertrace_explorer(learning)
Аналітика бізнес-процесів в R