การตรวจสอบผลลัพธ์ของ Logistic Regression

HR Analytics: การพยากรณ์การลาออกของพนักงานด้วย R

Anurag Gupta

People Analytics Practitioner

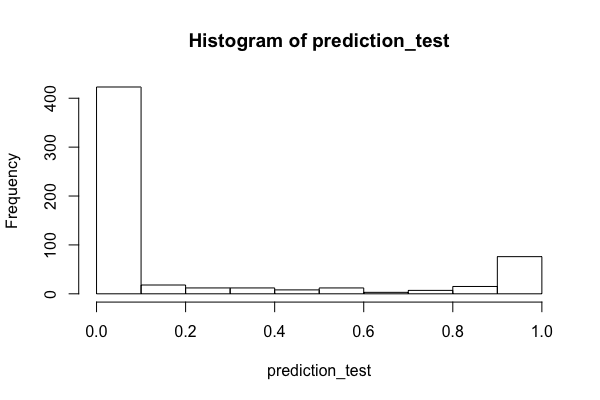
การกระจายความน่าจะเป็นของการลาออกในชุดทดสอบ
HR Analytics: การพยากรณ์การลาออกของพนักงานด้วย R

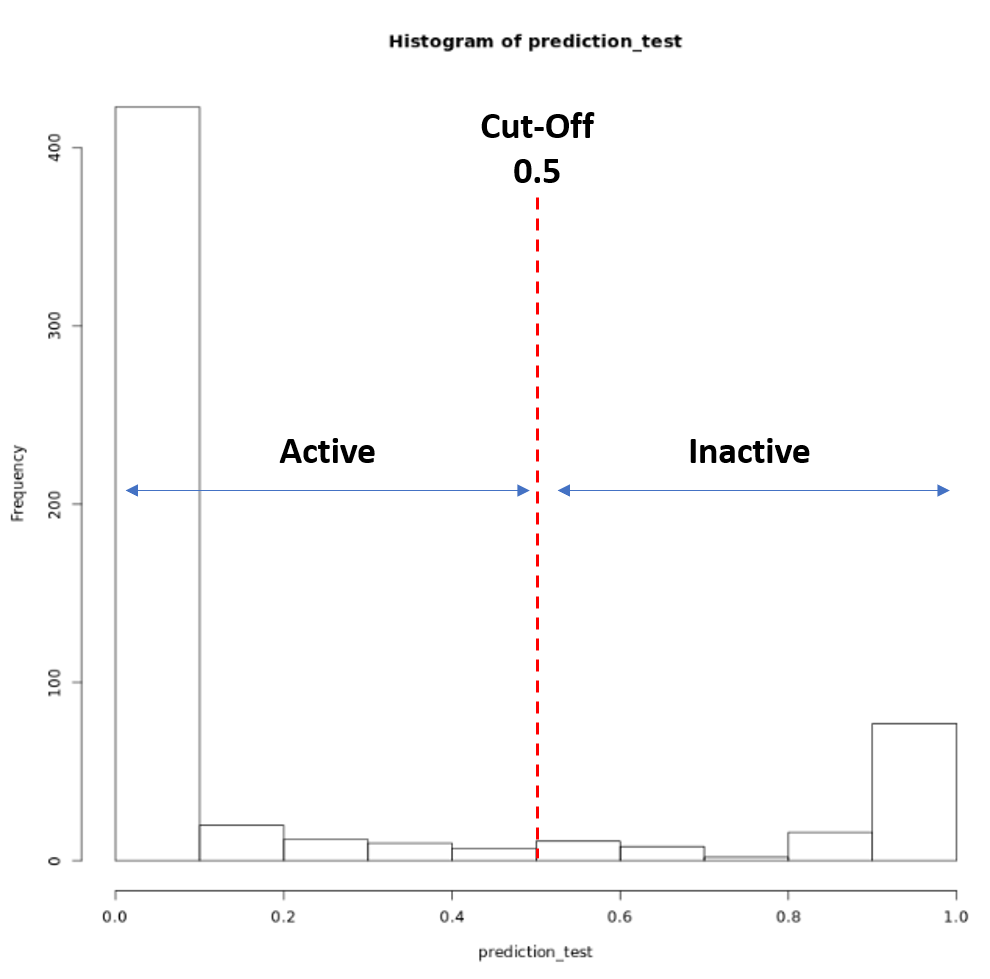
แปลงค่าความน่าจะเป็นเป็นหมวดหมู่โดยใช้ค่า Cut-off
HR Analytics: การพยากรณ์การลาออกของพนักงานด้วย R

แปลงค่าความน่าจะเป็นเป็นหมวดหมู่โดยใช้ค่า Cut-off

# Classify predictions using a cut-off of 0.5
pred_cutoff_50_test <- ifelse(predictions_test > 0.5, 1, 0)
HR Analytics: การพยากรณ์การลาออกของพนักงานด้วย R

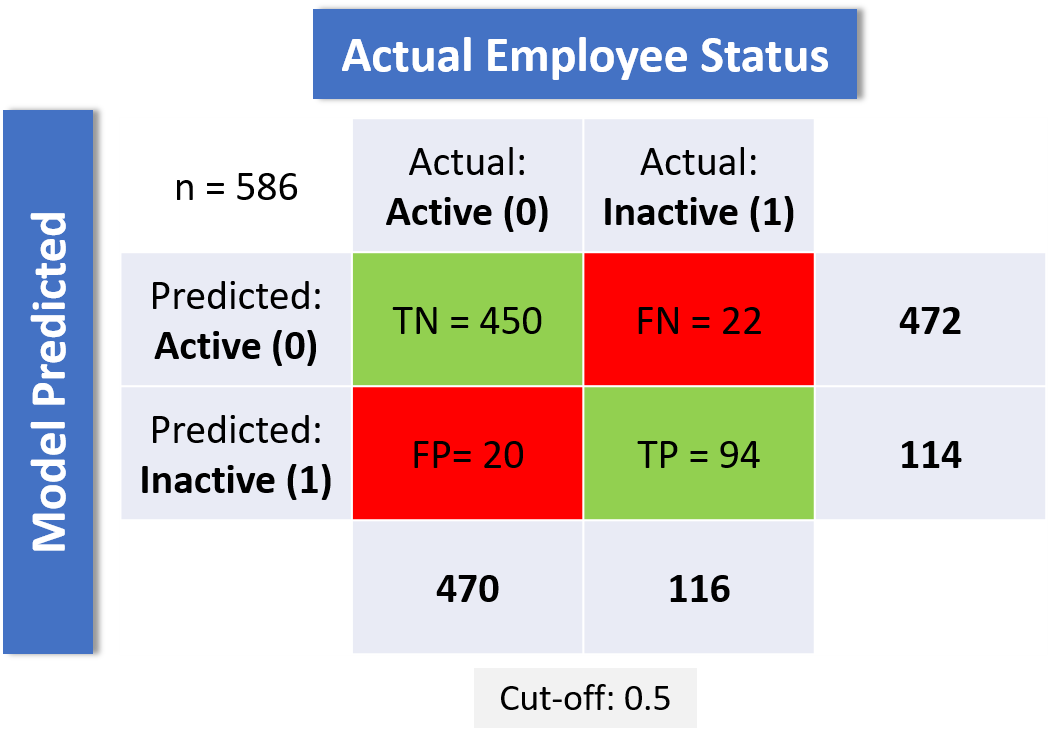
Confusion matrix คืออะไร?

Confusion matrix ใช้วัดประสิทธิภาพของโมเดลจำแนกประเภท

HR Analytics: การพยากรณ์การลาออกของพนักงานด้วย R

การสร้าง Confusion Matrix

## Creating confusion matrix
table(pred_cutoff_50_test, test_set$turnover)
prediction_categories   0   1
                    0 450  22
                    1  20  94
HR Analytics: การพยากรณ์การลาออกของพนักงานด้วย R

ทำความเข้าใจ Confusion Matrix

  • True negatives (TN): โมเดลระบุพนักงานที่ยังทำงานอยู่ได้ถูกต้อง
  • True positives (TP): โมเดลระบุพนักงานที่ลาออกแล้วได้ถูกต้อง
  • False positives (FP): โมเดลทำนายว่าพนักงานลาออก แต่จริงๆ ยังทำงานอยู่
  • False negatives (FN): โมเดลทำนายว่าพนักงานยังทำงานอยู่ แต่จริงๆ ลาออกแล้ว
HR Analytics: การพยากรณ์การลาออกของพนักงานด้วย R

Confusion Matrix: ความแม่นยำ

$$ \text{Accuracy} = \frac{\text{ TP + TN }}{\text{ TP + TN + FP + FN }} $$

$$ \text{Accuracy} = \frac{\text{ 450 + 94 }}{\text{ 450 + 94 + 22 + 20}} $$

$$ = $$

$$ \text{0.9283} $$

HR Analytics: การพยากรณ์การลาออกของพนักงานด้วย R

การสร้าง Confusion Matrix

# Load library
library(caret)

# Construct a confusion matrix
conf_matrix_50 <- confusionMatrix(table(test_set$turnover, 
                                        pred_cutoff_50_test))
HR Analytics: การพยากรณ์การลาออกของพนักงานด้วย R
conf_matrix_50
Confusion Matrix and Statistics

prediction_categories   0   1
                    0 450  22
                    1  20  94

               Accuracy : 0.9283          
                 95% CI : (0.9044, 0.9479)
    No Information Rate : 0.802           
    P-Value [Acc > NIR] : <2e-16                                        
                  Kappa : 0.7728          
 Mcnemar's Test P-Value : 0.8774                                       
            Sensitivity : 0.9574          
            Specificity : 0.8103          
         Pos Pred Value : 0.9534          
         Neg Pred Value : 0.8246          
             ... 
HR Analytics: การพยากรณ์การลาออกของพนักงานด้วย R

แหล่งเรียนรู้เพิ่มเติม

HR Analytics: การพยากรณ์การลาออกของพนักงานด้วย R

มาฝึกกันเถอะ!

HR Analytics: การพยากรณ์การลาออกของพนักงานด้วย R

Preparing Video For Download...