Parameterestimering

Blandningsmodeller i R

Victor Medina

Researcher at The University of Edinburgh
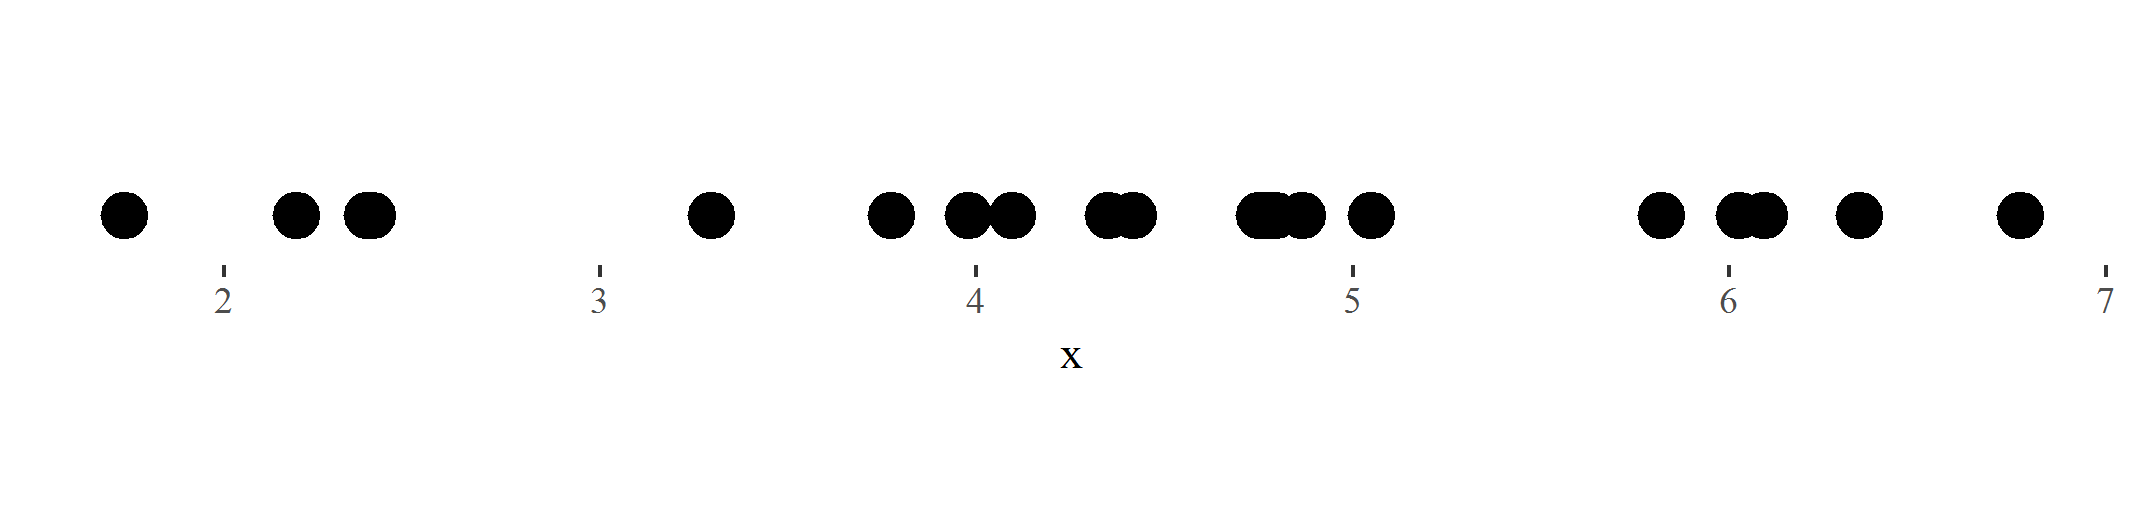
head(data)
         x
1 3.294453
2 5.818586
3 2.380493
4 4.415913
5 5.048659
6 4.750195

Blandningsmodeller i R

Antaganden

  1. Vilken fördelning? $\rightarrow$ Gaussisk fördelning $\checkmark$
  2. Antal kluster? $\rightarrow$ 2 kluster $\checkmark$
  3. Vilka parametrar?
    • 2 medelvärden
    • 2 proportioner
    • 2 sd $\rightarrow$ båda lika med 1 $\checkmark$

$\Rightarrow$ 4 parametrar att estimera! (2 medelvärden och 2 proportioner)

Blandningsmodeller i R

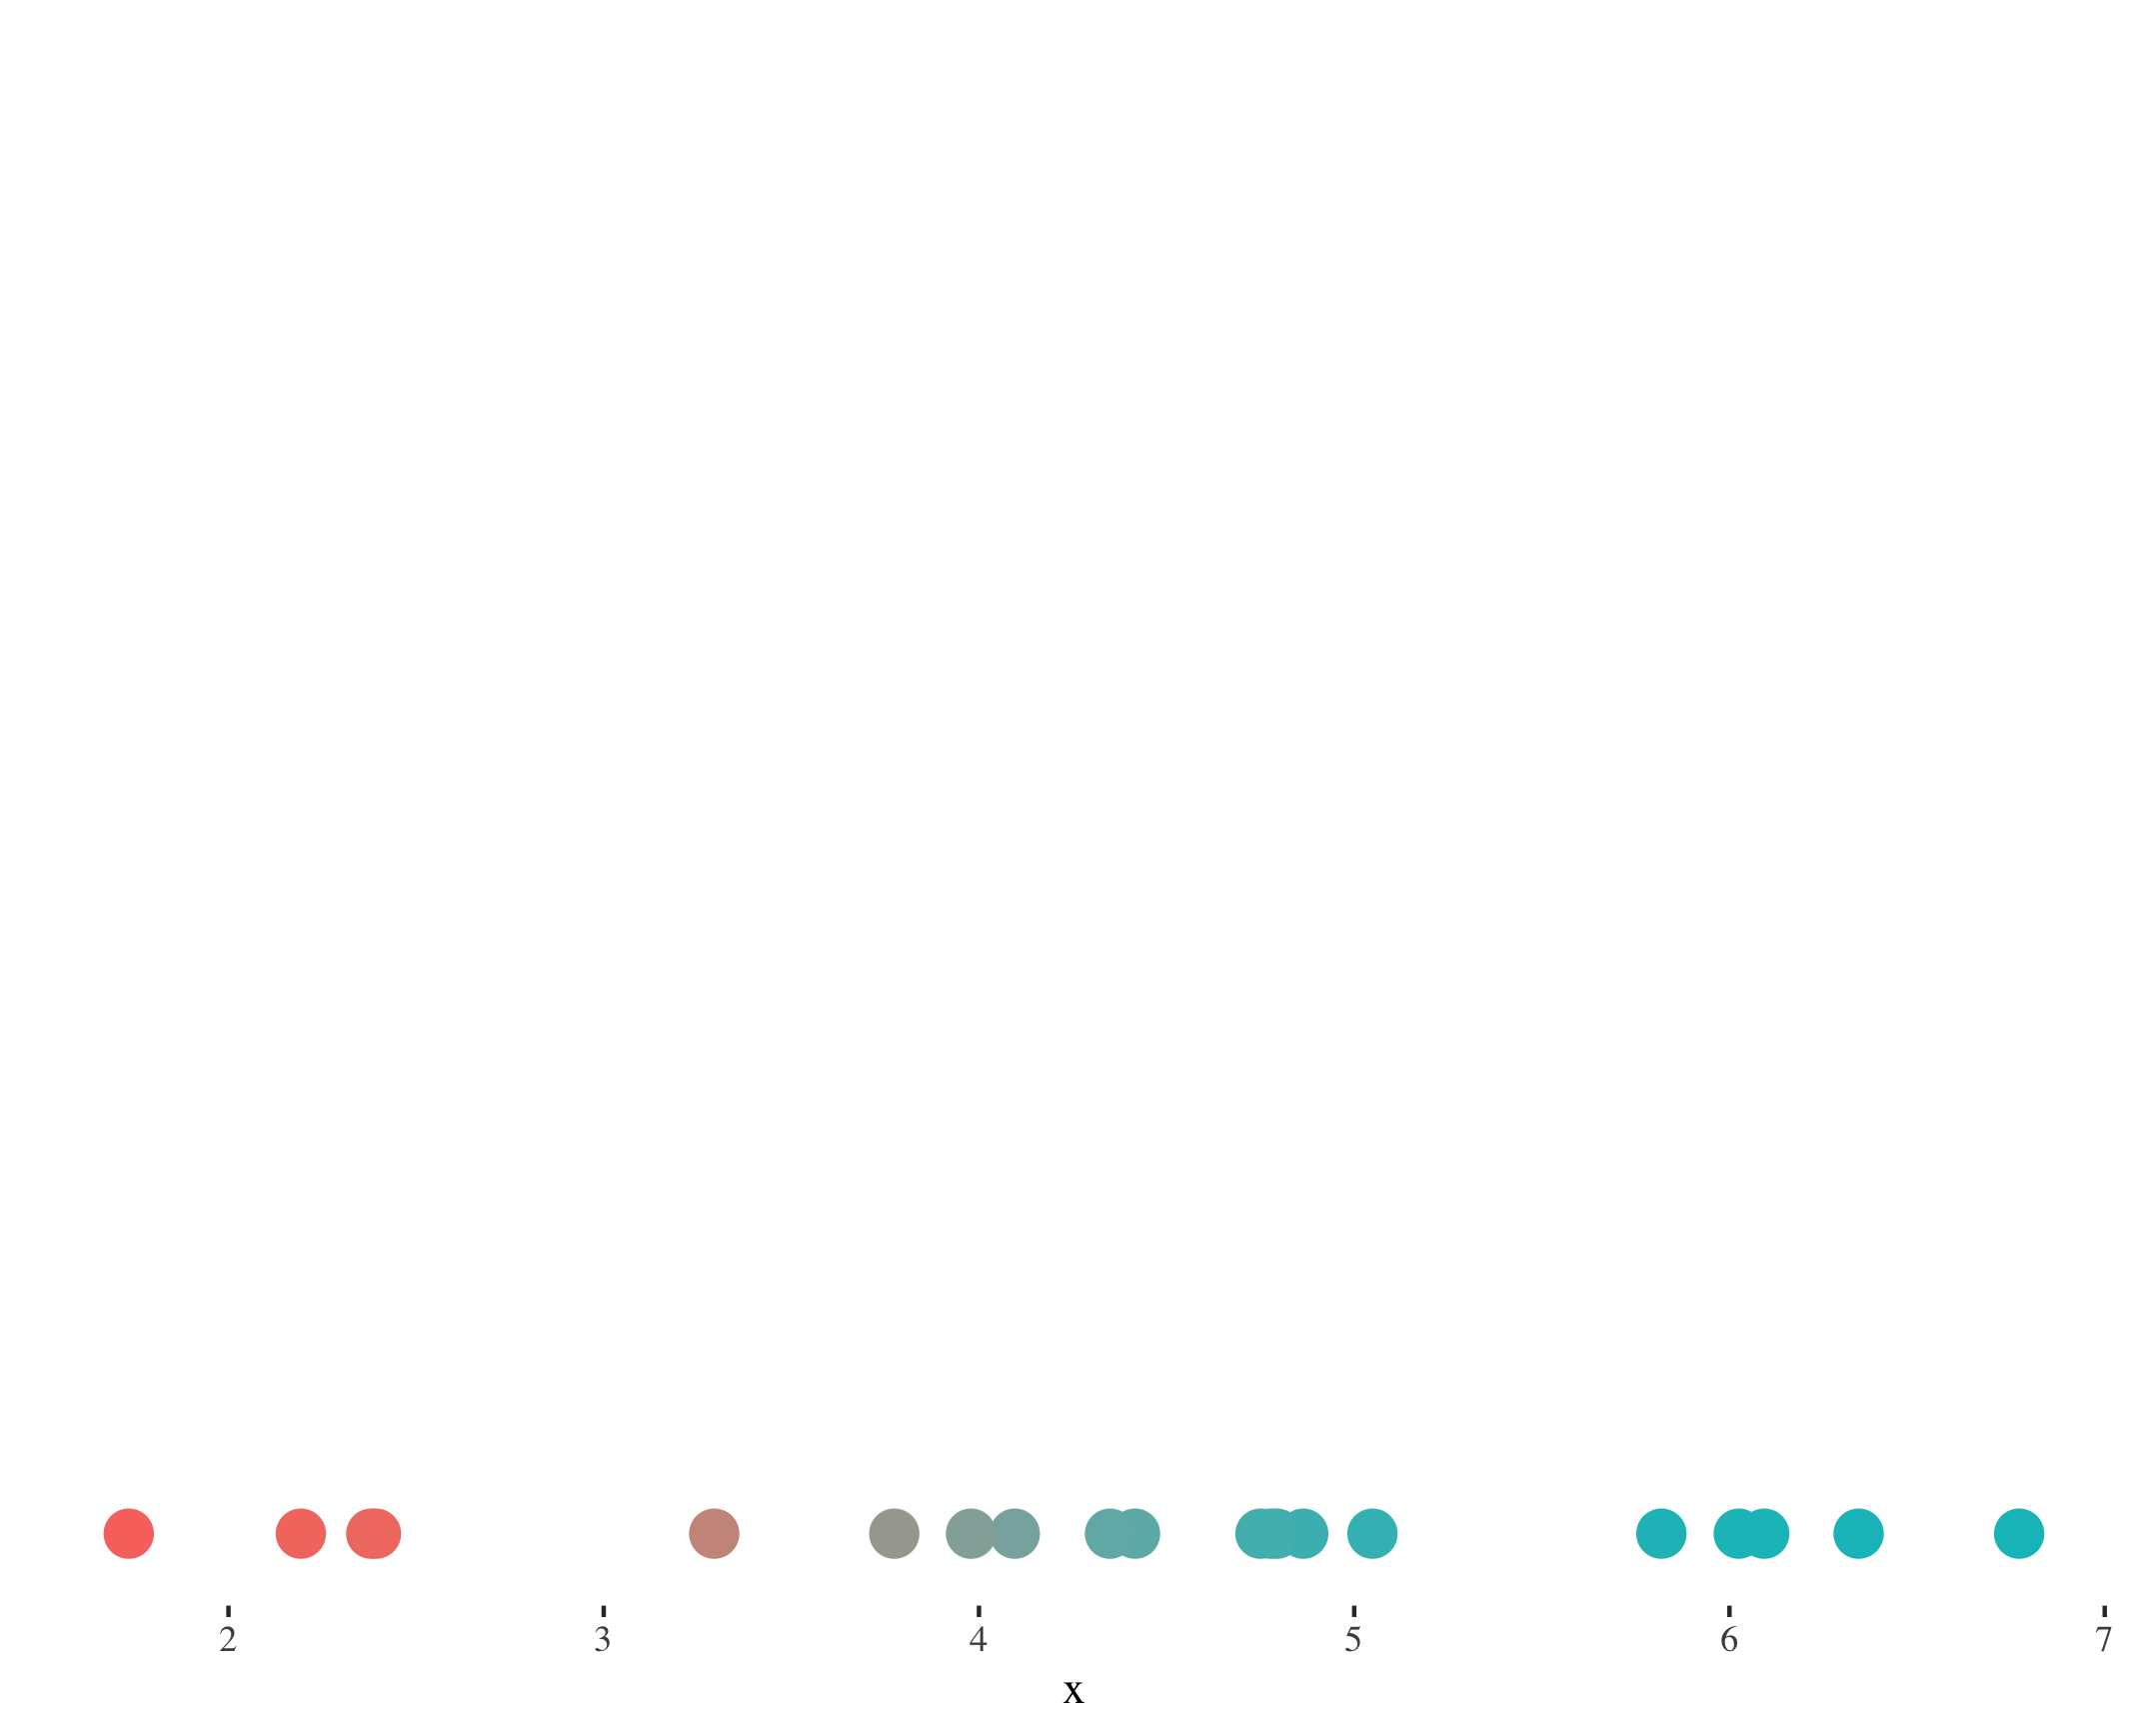
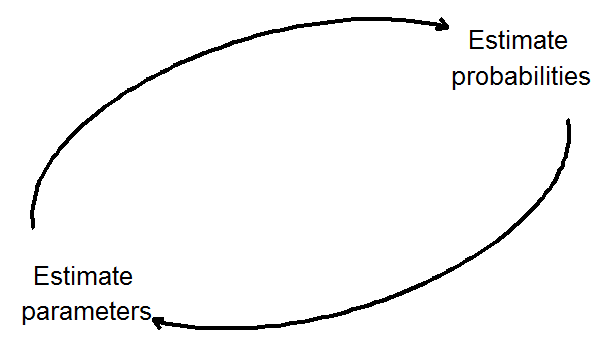
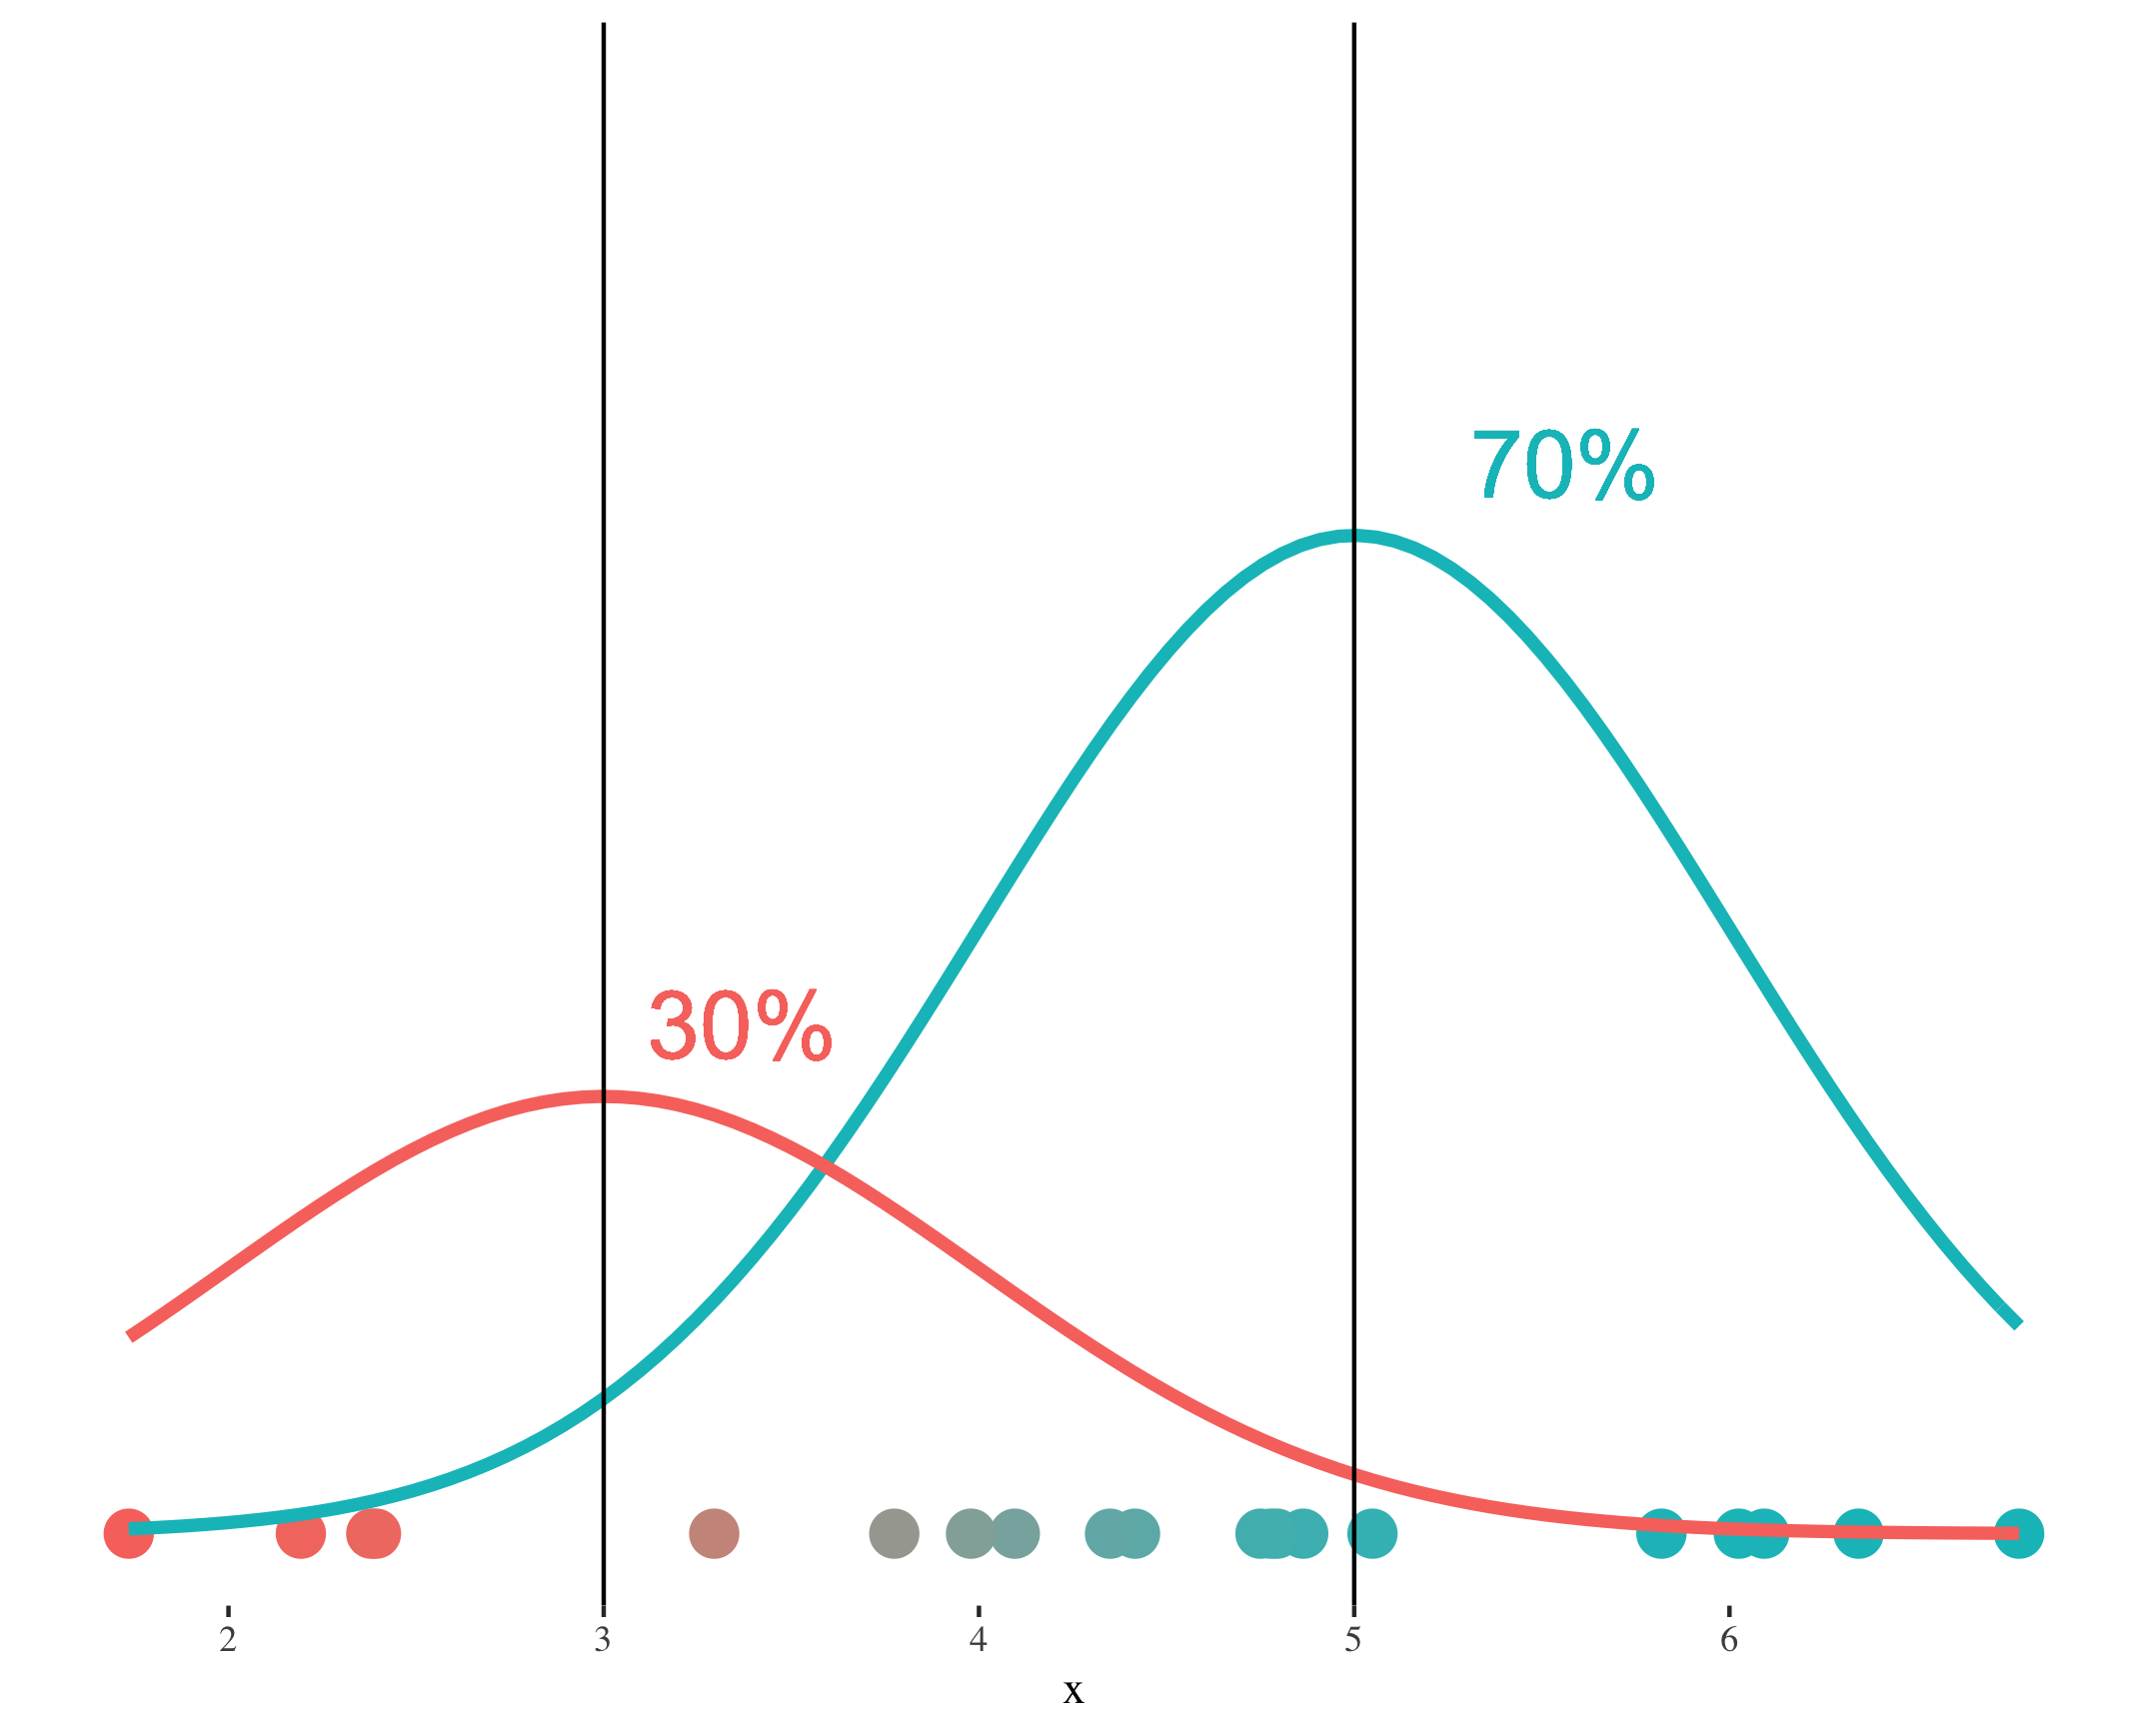
1 Kända sannolikheter $\rightarrow$

Estimera medelvärden och proportioner
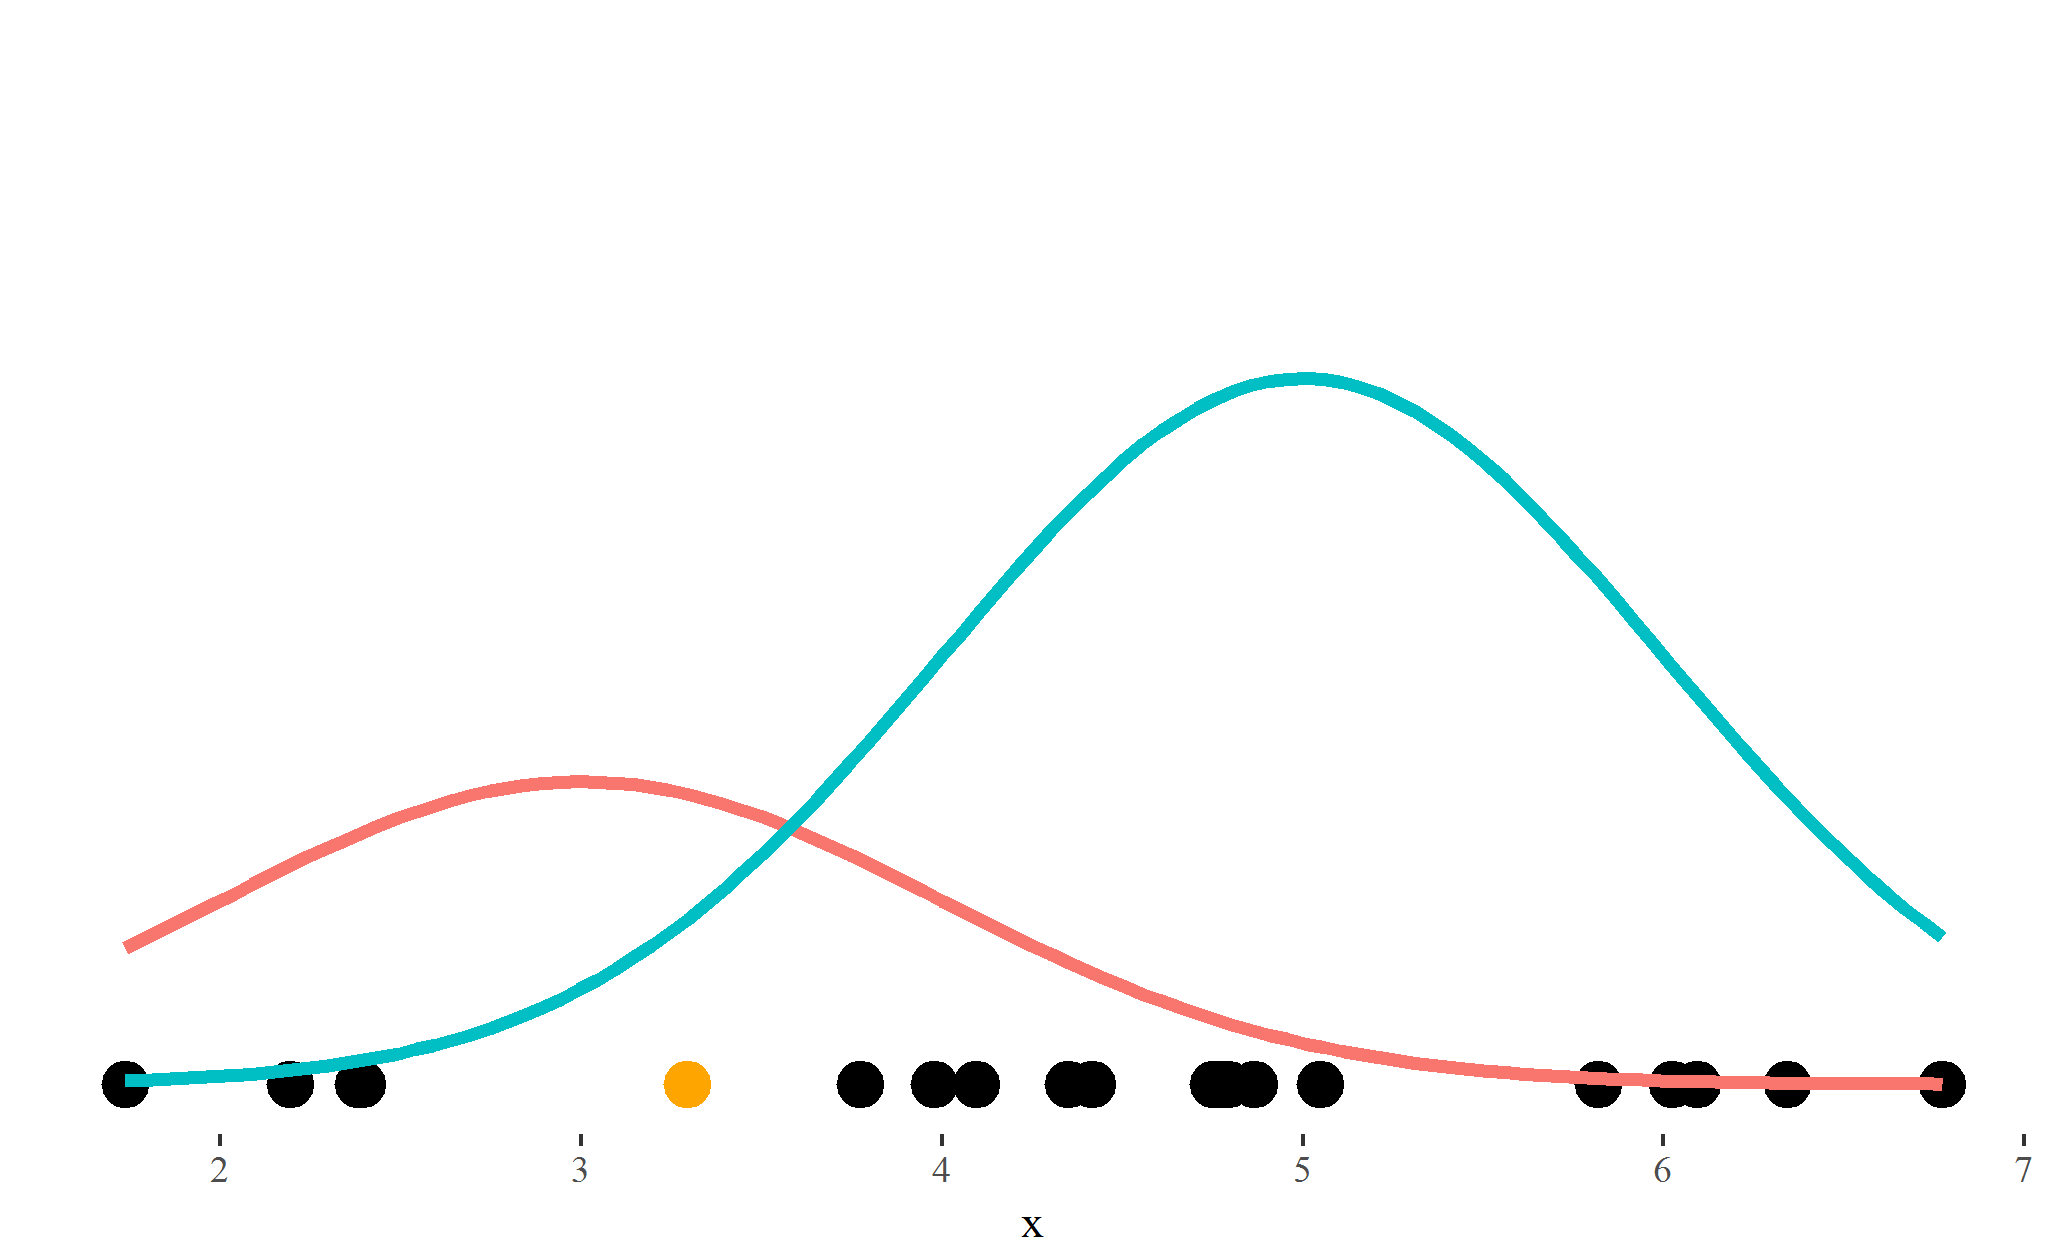
2 Kända medelvärden och proportioner $\rightarrow$
Estimera sannolikheter
Blandningsmodeller i R

Steg 1: Kända sannolikheter

head(data_with_probs)
         x prob_red prob_blue
1 3.294453     0.64      0.36
2 5.818586     0.01      0.99
3 2.380493     0.92      0.08
4 4.415913     0.16      0.84
5 5.048659     0.05      0.95
6 4.750195     0.09      0.91

Blandningsmodeller i R

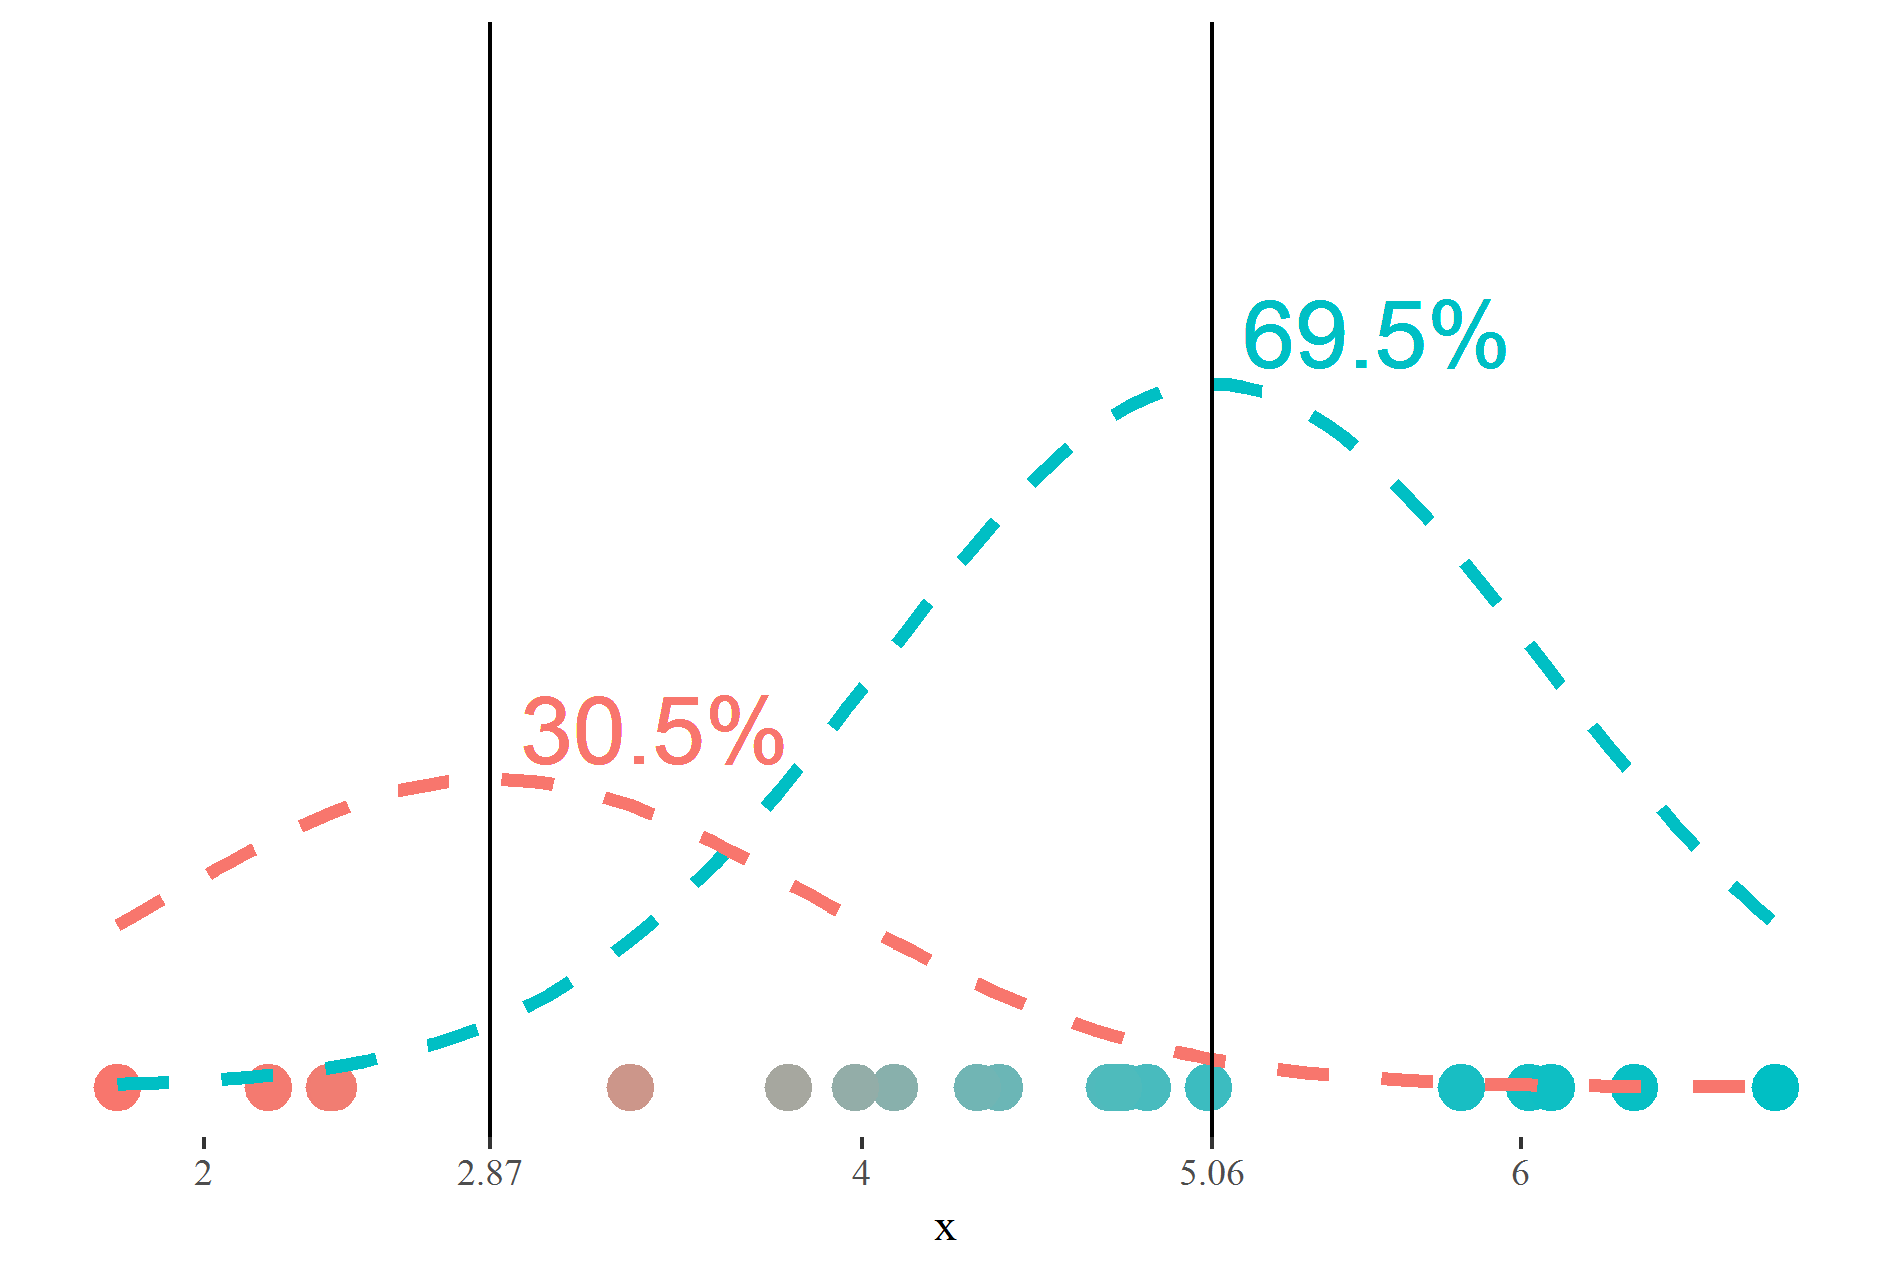
För medelvärden

means_estimates <- data_with_probs %>%
   summarise(mean_red = sum(x * prob_red) / sum(prob_red),
             mean_blue = sum(x * prob_blue) / sum(prob_blue))
means_estimates
  mean_red mean_blue
1  2.86925  5.062976

För proportioner

proportions_estimates <- data_with_probs %>% 
   summarise(proportion_red = mean(prob_red),
             proportion_blue = 1 - proportion_red)
proportions_estimates
  proportion_red proportion_blue
1          0.305           0.695
Blandningsmodeller i R

Blandningsmodeller i R

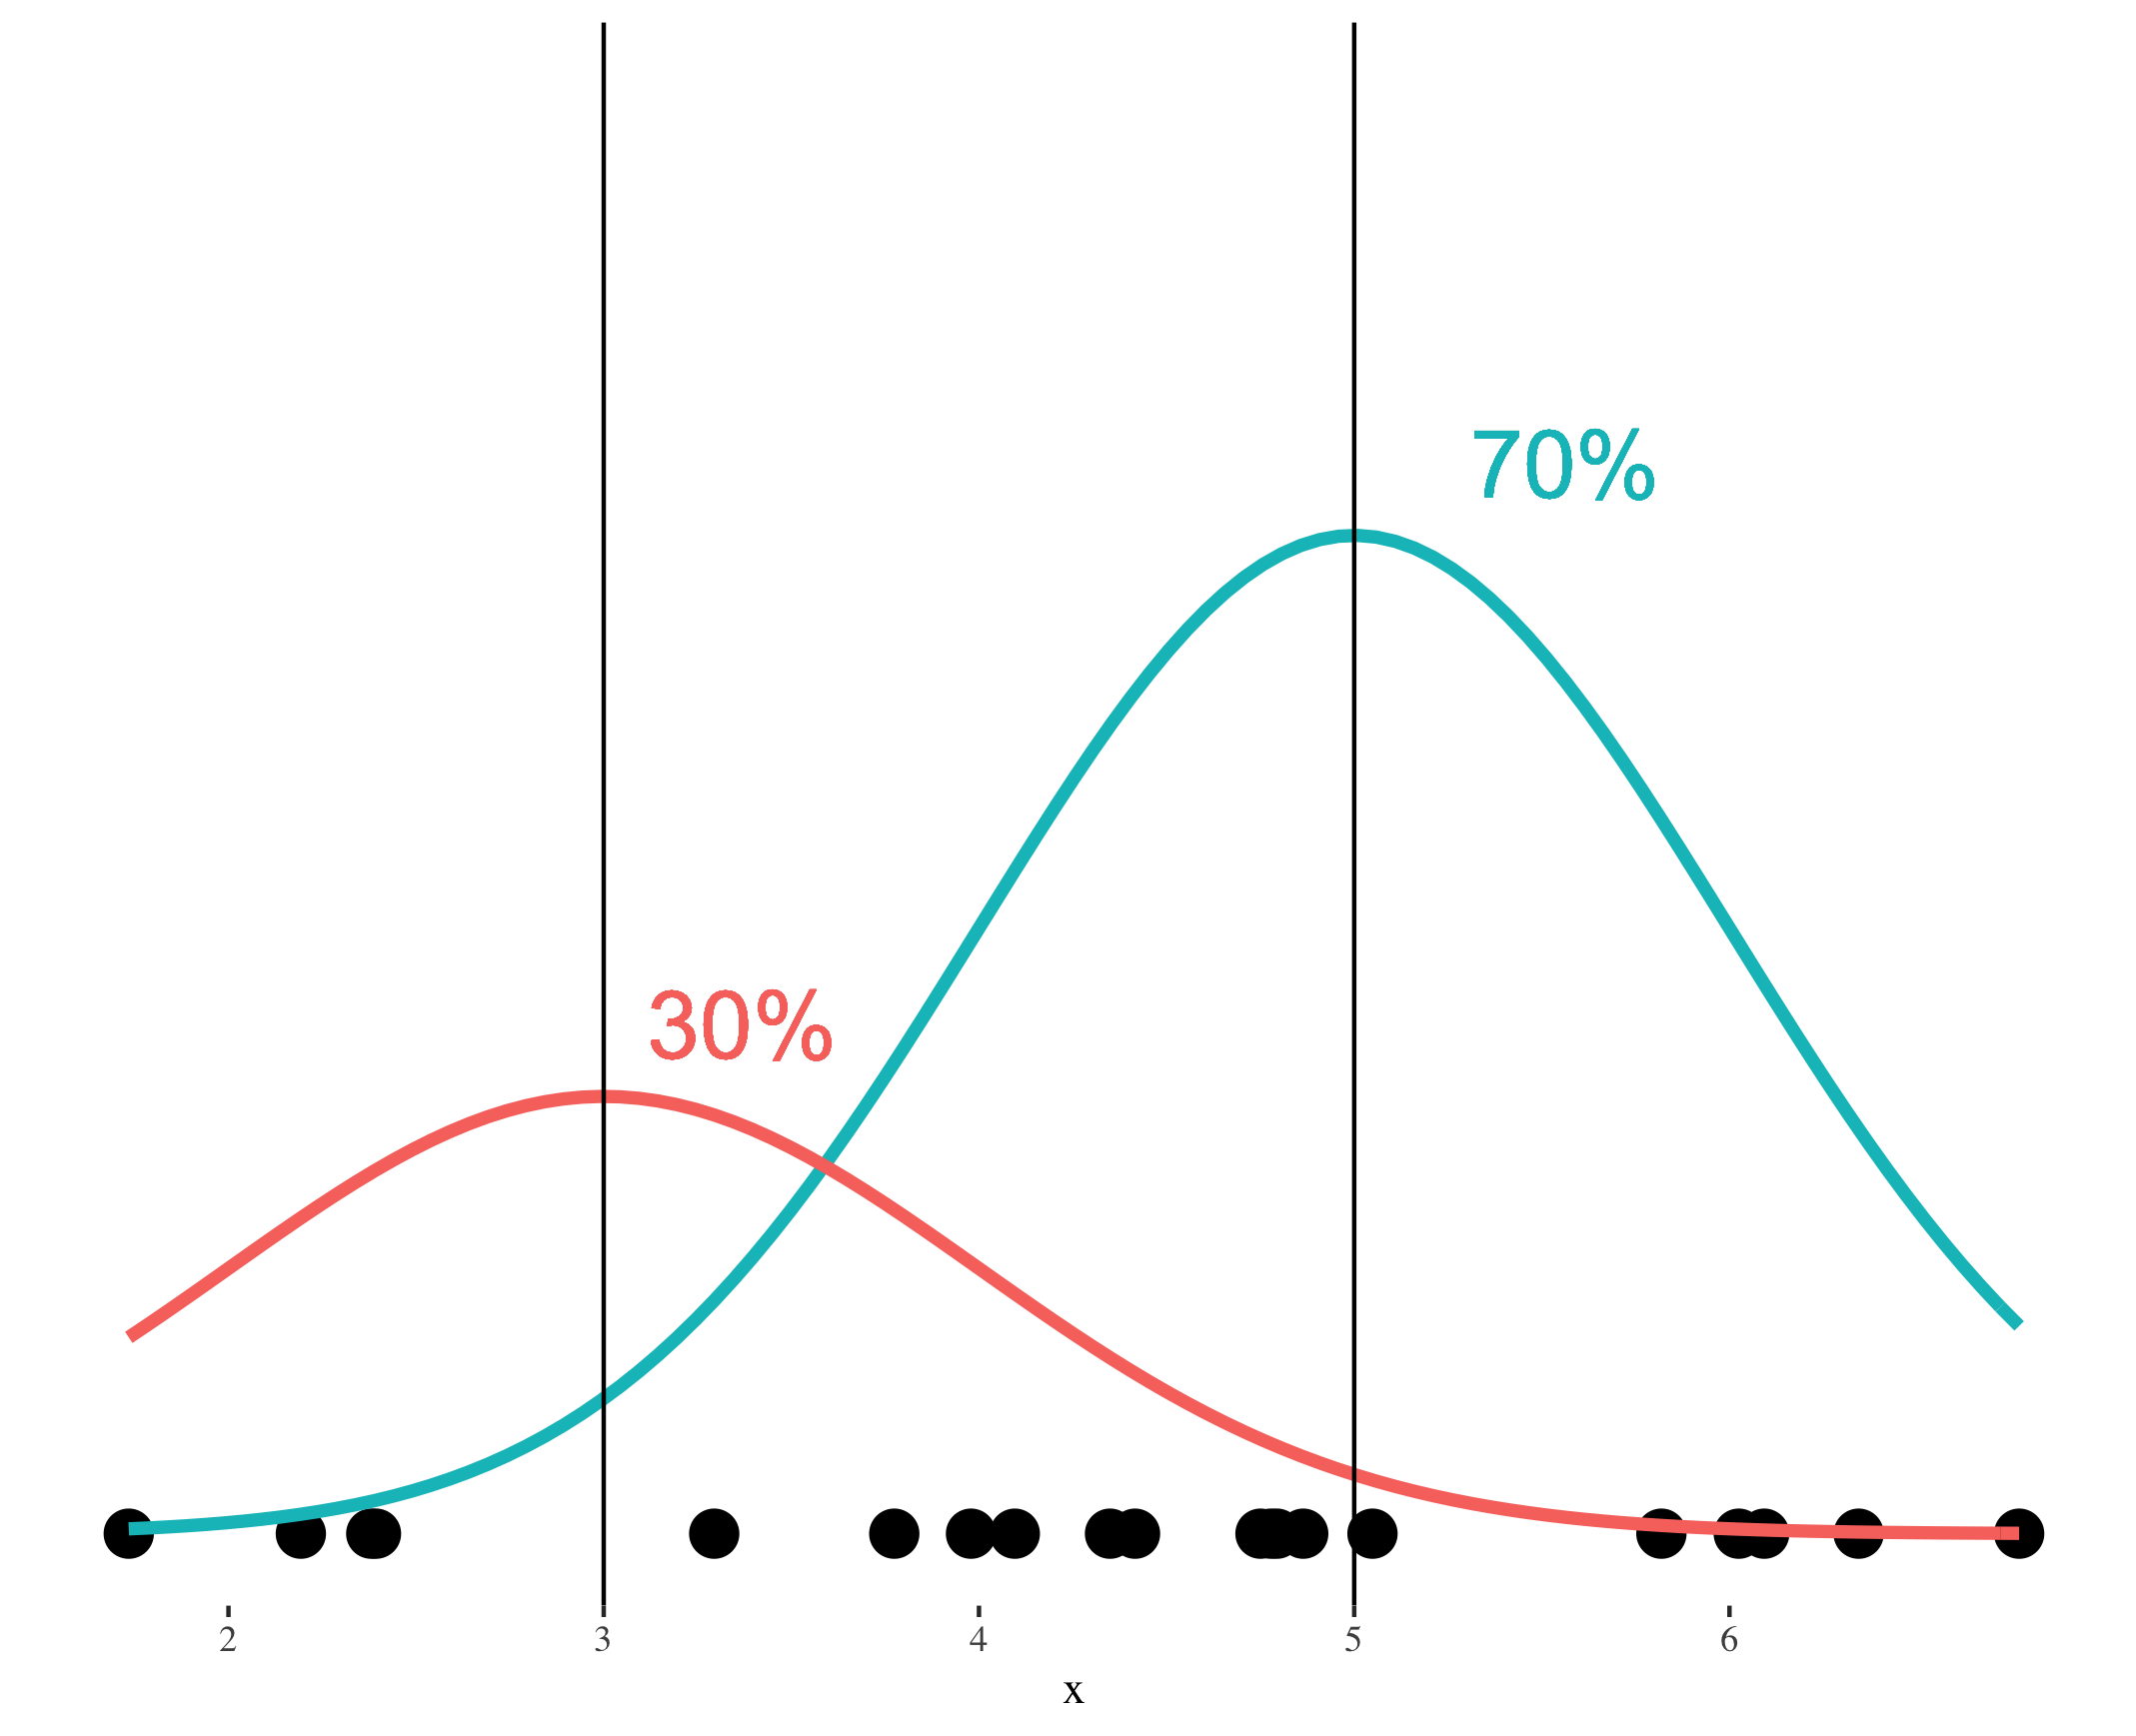
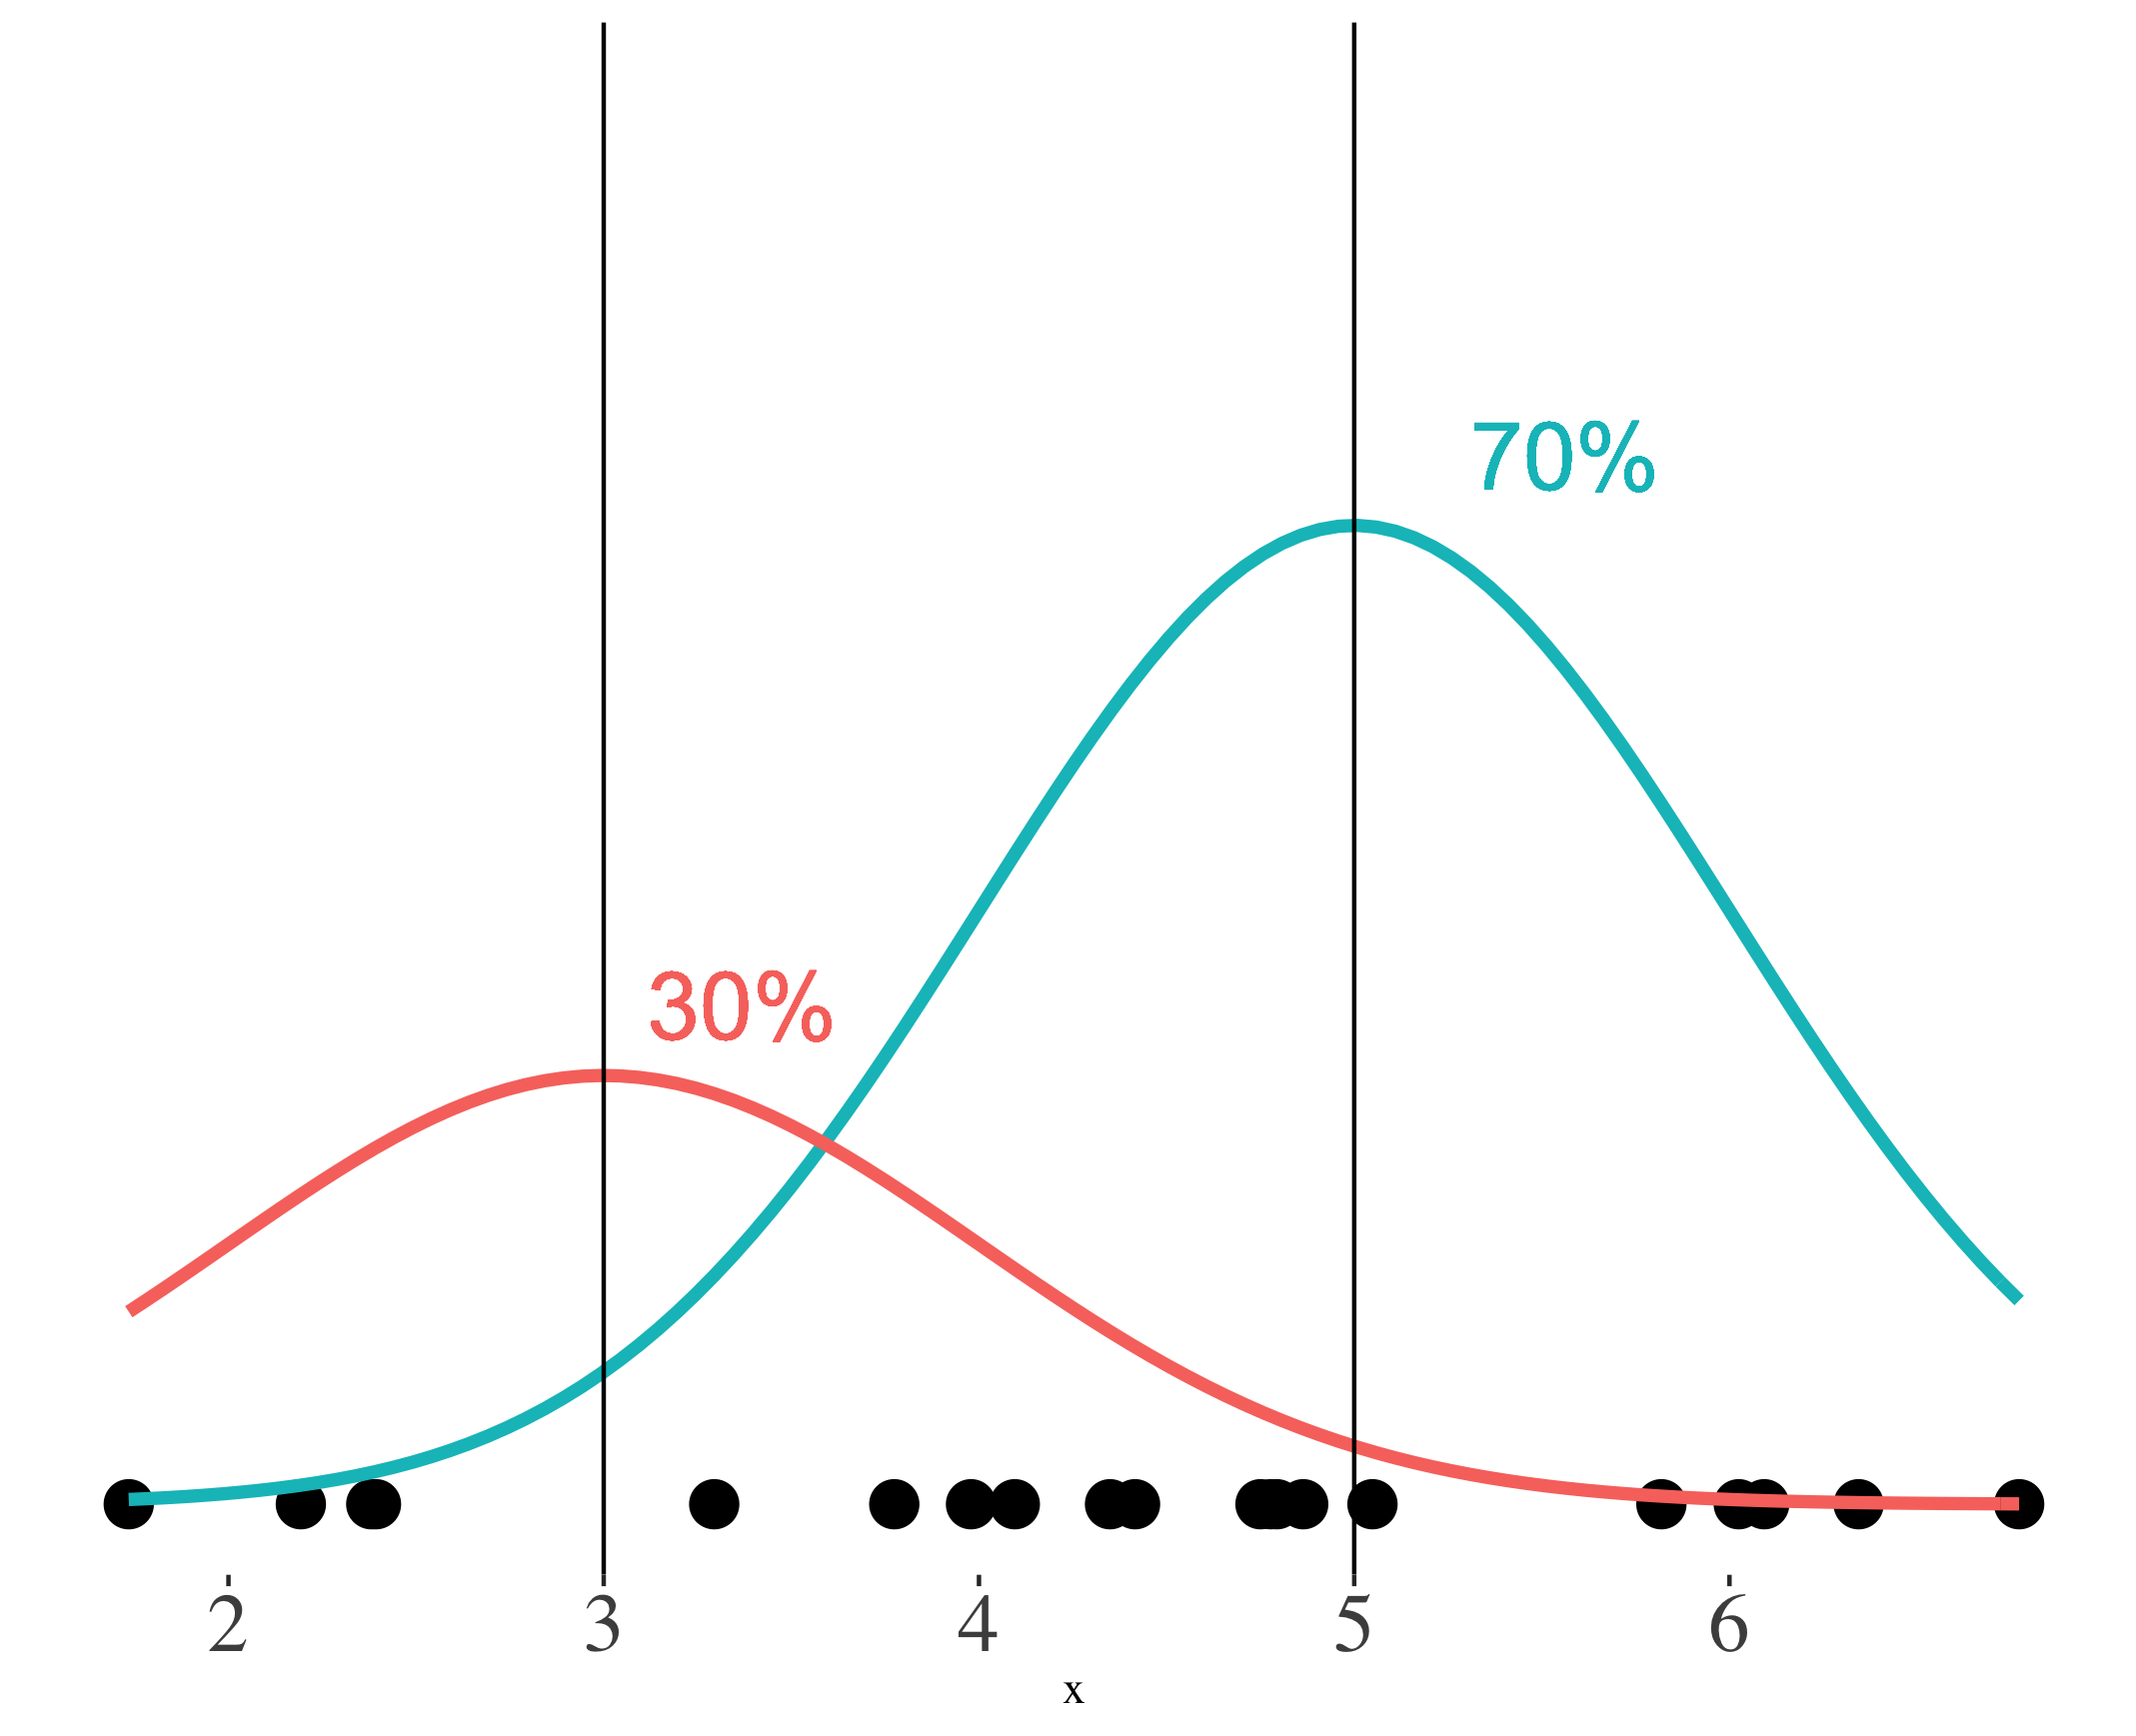
Steg 2: Kända medelvärden och proportioner
Blandningsmodeller i R

Blandningsmodeller i R

Blandningsmodeller i R

Blandningsmodeller i R

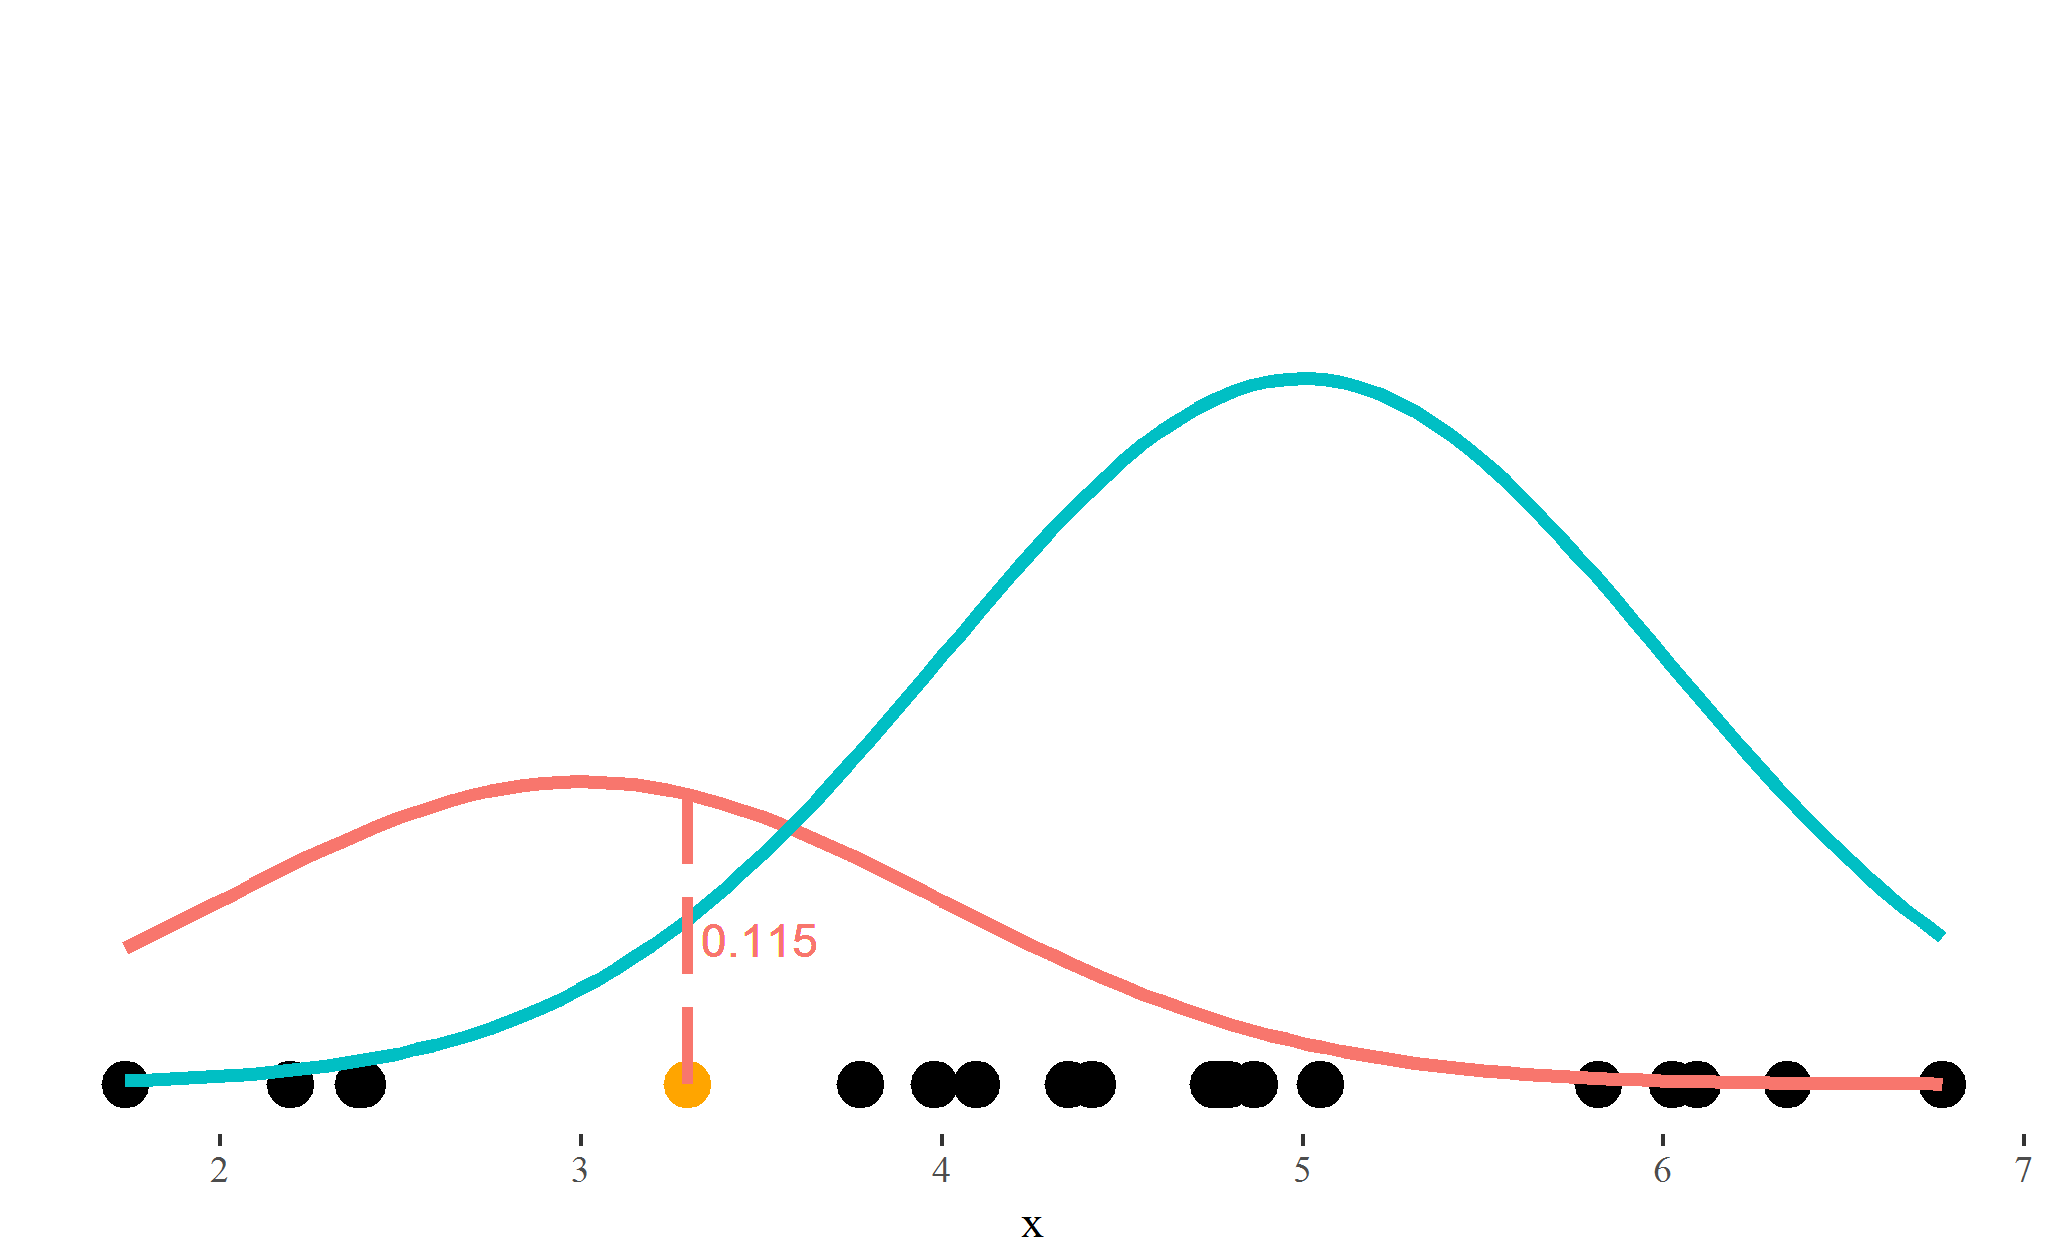
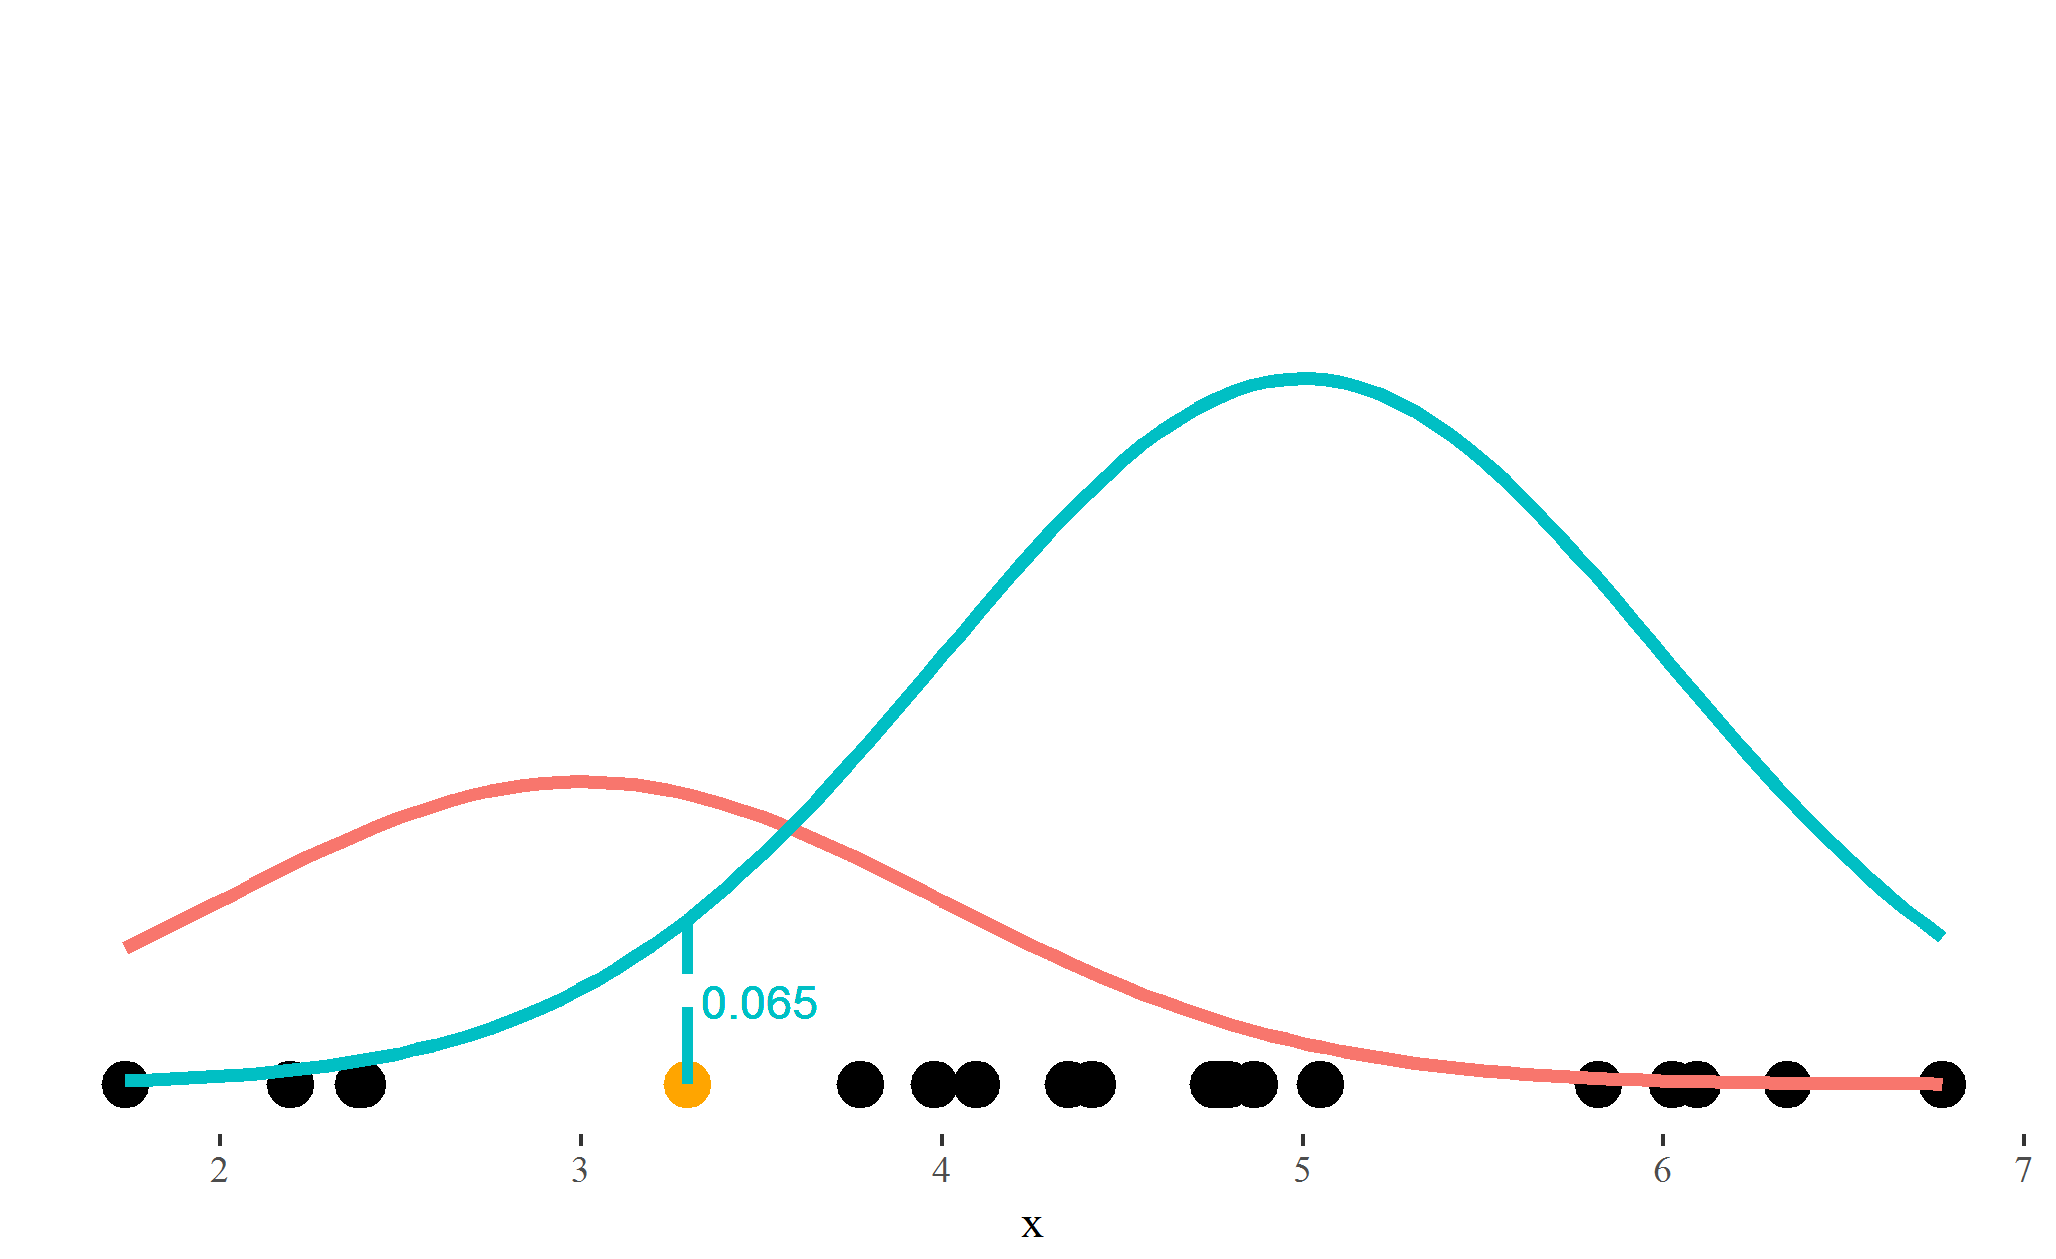
Steg 2: Skalade sannolikheter

$\text{Sannolikhet}_{\text{ blå}}=\frac{0{,}065}{0{,}115 + 0{,}065}=0{,}36$

data %>% 
   mutate(prob_from_red = 0.3 * dnorm(x, mean = 3),
          prob_from_blue = 0.7 * dnorm(x,mean = 5),
          prob_red = prob_from_red/(prob_from_red + prob_from_blue),
          prob_blue = prob_from_blue/(prob_from_red + prob_from_blue)) %>% 
   select(x, prob_red, prob_blue) %>% head(4)
         x   prob_red  prob_blue
1 3.294453 0.63733037 0.36266963
2 5.818586 0.01115698 0.98884302
3 2.380493 0.91619343 0.08380657
4 4.415913 0.15721146 0.84278854
Blandningsmodeller i R

Sammanfattning

  • När sannolikheterna är kända $\rightarrow$ estimera medelvärden och proportioner
  • När medelvärden och proportioner är kända $\rightarrow$ estimera sannolikheterna

Blandningsmodeller i R

Nu kör vi en övning!

Blandningsmodeller i R

Preparing Video For Download...