Modeller för individuell efterfrågan

Bygga responsmodeller i R

Kathrin Gruber

Assistant Professor of Econometrics Erasmus University Rotterdam

Kundköp

str(choice.data)
'data.frame':    2798 obs. of  15 variables:
 $ OBS          : int  1 2 3 4 5 6 7 8 9 10 ...
 $ HOUSEHOLDID  : int  1 1 1 1 1 1 1 1 1 1 ...
 $ LASTPURCHASE : int  0 0 0 0 0 0 0 0 0 0 ...
 $ BUD          : int  1 1 1 1 1 1 1 1 1 1 ...
 $ HOPPINESS    : int  0 0 0 0 0 0 0 0 0 0 ...
 $ PRICE.BUD    : num  0.052 0.052 0.046 0.052 0.046 ...
 ...
  • OBS-ervationsvecka.
  • HOUSEHOLDID för inköpsposterna.
  • LASTPURCHASE registrerat för hushållet.
Bygga responsmodeller i R

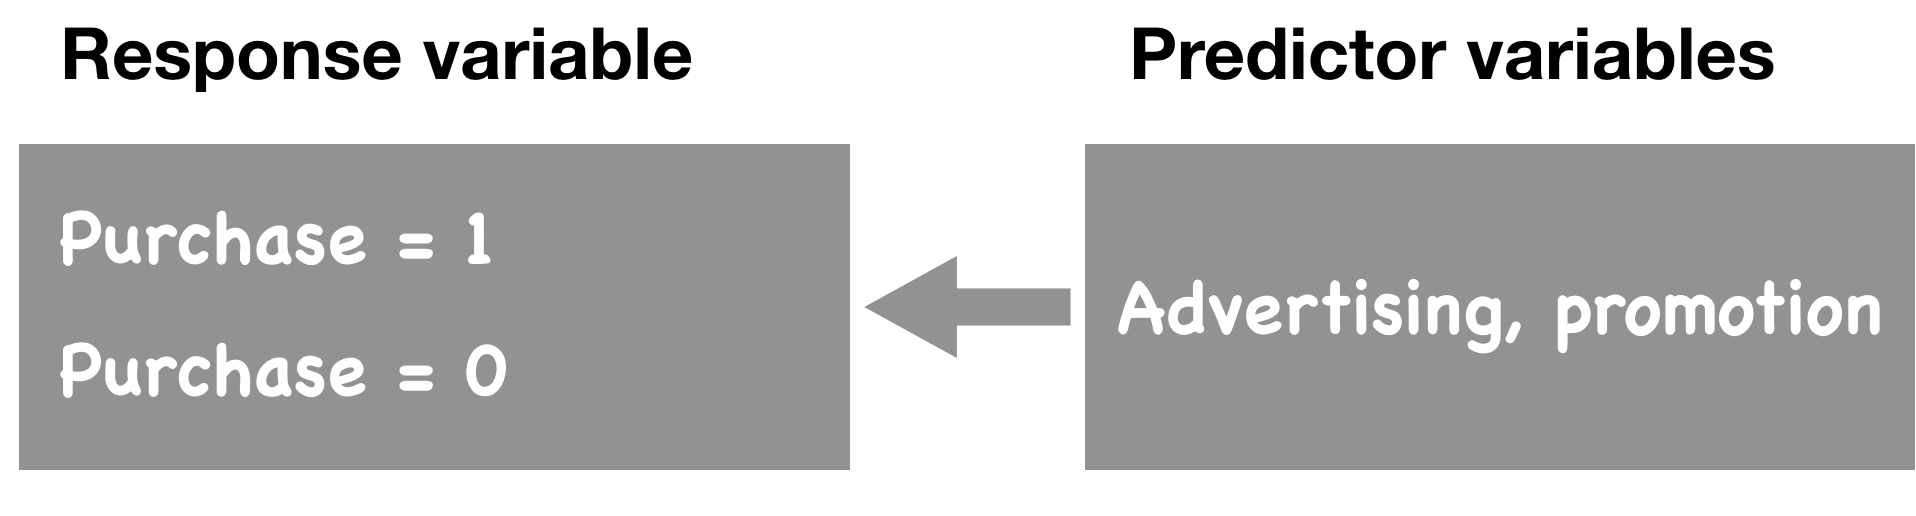
Att köpa eller inte köpa?

  • Linjär sannolikhetsmodell $$\textsf{Pr}(\textsf{Purchase}=1) = f(\textsf{Advertising, Promotion})$$
Bygga responsmodeller i R

Konkurrens

price.ratio <- log(choice.data$PRICE.HOP/choice.data$PRICE.BUD)

head(cbind(price.ratio, choice.data$PRICE.BUD, choice.data$PRICE.HOP))
     price.ratio            
[1,] -0.42488315 0.052 0.034
[2,] -0.16705410 0.052 0.044
[3,]  0.04255961 0.046 0.048
[4,] -0.42488315 0.052 0.034
[5,]  0.04255961 0.046 0.048
[6,] -0.44895021 0.047 0.030
Bygga responsmodeller i R

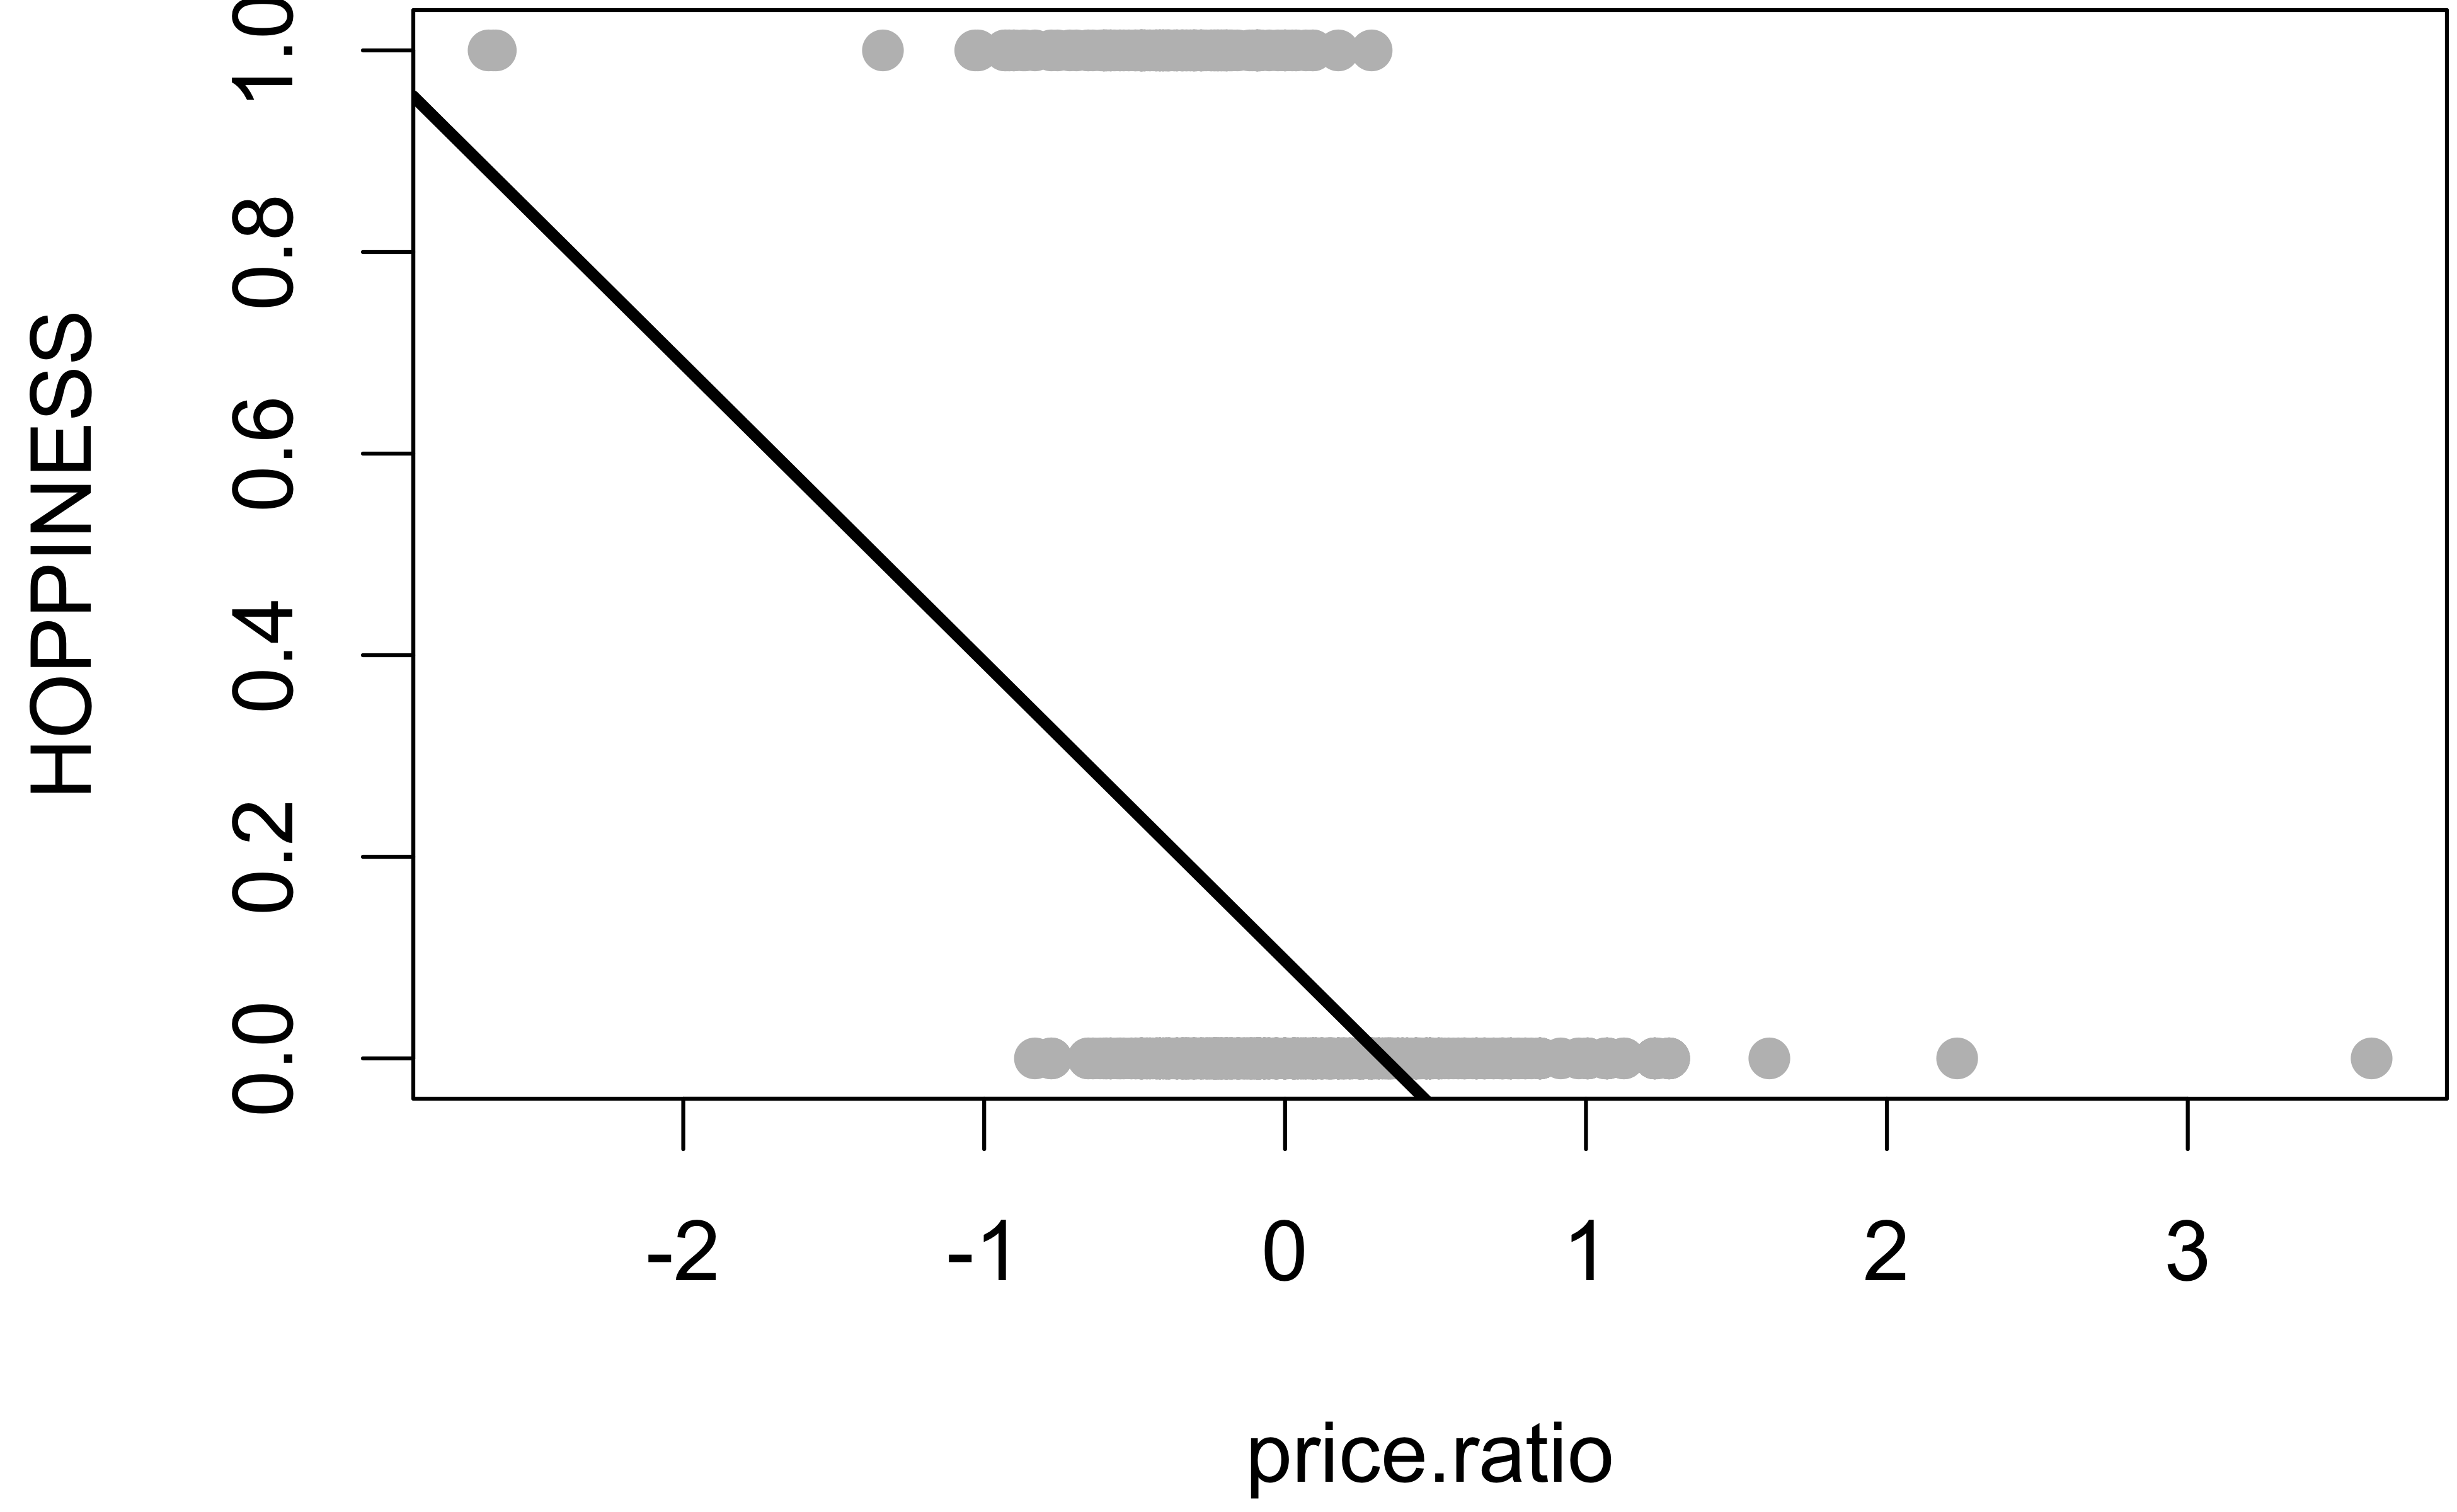
En linjär sannolikhetsmodell för ölefterfrågan

probability.model <- lm(HOPPINESS ~ price.ratio, data = choice.data)

plot(HOPPINESS ~ price.ratio, data = choice.data)
abline(probability.model)
Bygga responsmodeller i R

Nu kör vi en övning!

Bygga responsmodeller i R

Preparing Video For Download...