การแสดงภาพข้อมูลเชิงหมวดหมู่

การสร้างภาพข้อมูลแบบอินเทอร์แอกทีฟด้วย Bokeh

George Boorman

Core Curriculum Manager, DataCamp

ข้อมูลเชิงหมวดหมู่

  • ข้อมูลเชิงหมวดหมู่คือข้อมูลที่มีตัวเลือกหรือป้ายกำกับจำนวนคงที่

    • ตัวอย่างเช่น เพศ หรือประเทศที่เกิด
  • Factors เป็นอีกคำหนึ่งที่ใช้เรียกตัวแปรเชิงหมวดหมู่

print(nba[["position", "team", "conference"]].head())
    position    team    conference
0   PG          OKC     West
1   PG          HOU     West
2   PG          BOS     East
3   C           NO      West
4   SG          TOR     East
การสร้างภาพข้อมูลแบบอินเทอร์แอกทีฟด้วย Bokeh

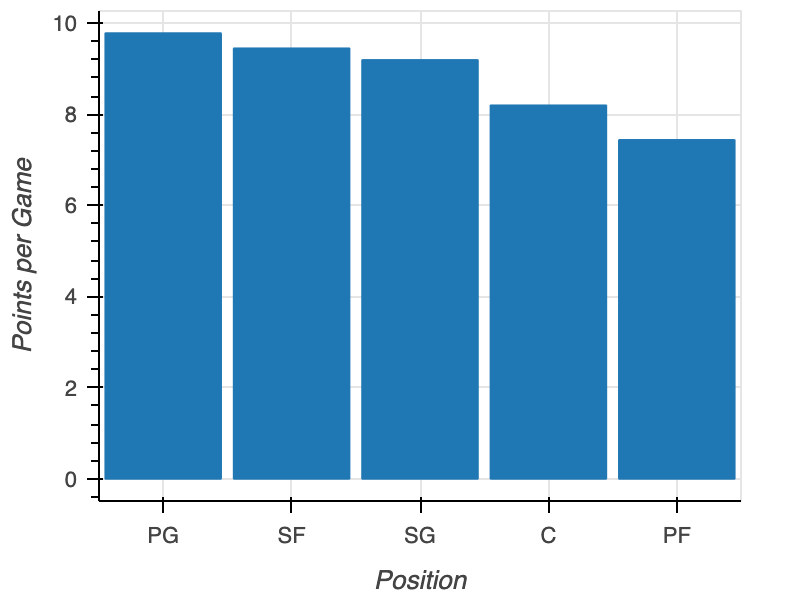
การจัดเรียง

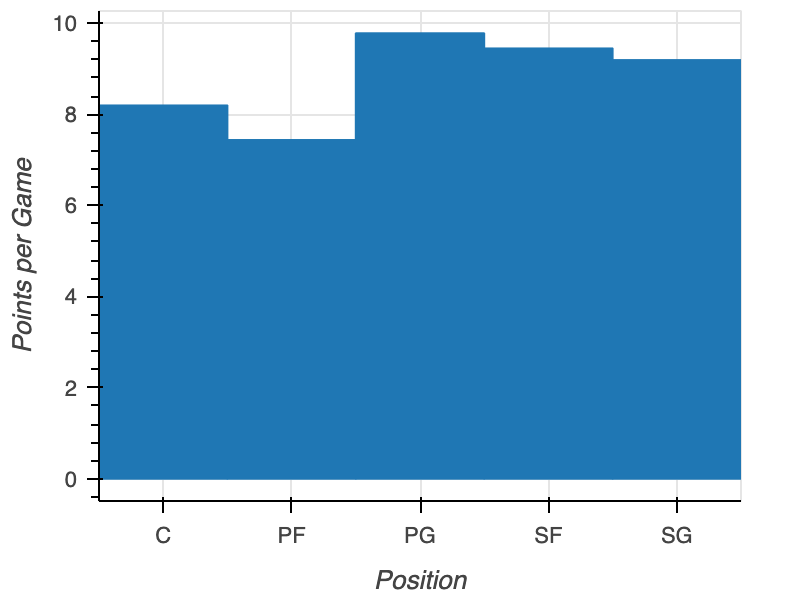
กราฟแท่งที่ยังไม่ได้จัดเรียง

pos = nba.groupby("position")["points"].mean()
pos = pos.sort_values("points", ascending=False)

fig = figure(x_range=pos["position"], x_axis_label="Position", y_axis_label="Points per Game") fig.vbar(x=pos["position"], top=pos["points"]) output_file(filename="sorted_plot.html") show(fig)
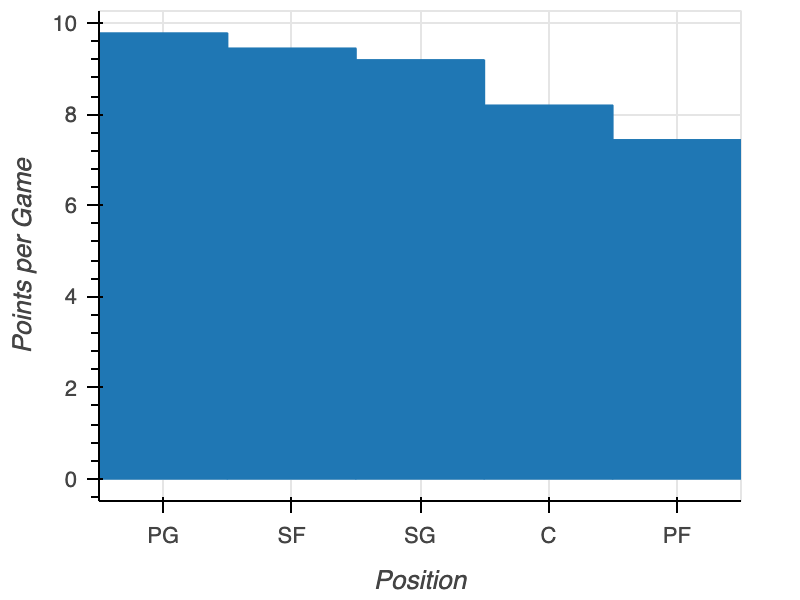
กราฟแท่งที่จัดเรียงแล้ว

การสร้างภาพข้อมูลแบบอินเทอร์แอกทีฟด้วย Bokeh

Padding

fig = figure(x_range=nba["position"], 
             x_axis_label="Position", 
             y_axis_label="Points per Game")
fig.vbar(x=nba["position"], top=nba["points"],

width=0.9)
output_file(filename="padded_plot.html") show(fig)

กราฟแท่งที่จัดเรียงและเพิ่ม padding แล้ว

การสร้างภาพข้อมูลแบบอินเทอร์แอกทีฟด้วย Bokeh

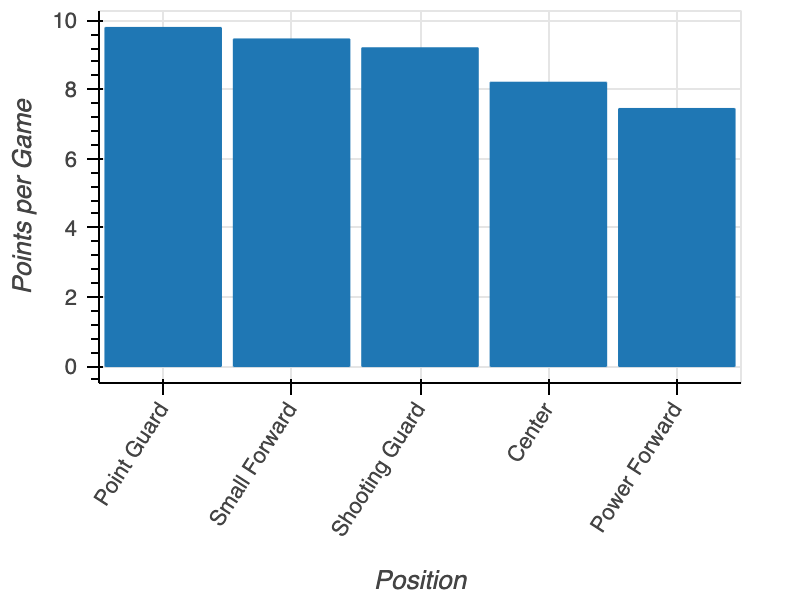
การหมุนป้ายกำกับ

fig = figure(x_range=nba['position'], 
             x_axis_label="Position", 
             y_axis_label="Points per Game")
fig.vbar(x=nba["position"], top=nba["points"], width=0.9)

fig.xaxis.major_label_orientation = 45
output_file(filename="rotated_x_label_plot.html") show(fig)
การสร้างภาพข้อมูลแบบอินเทอร์แอกทีฟด้วย Bokeh

ป้ายกำกับแกน x ที่หมุนแล้ว

กราฟที่หมุนป้ายกำกับแล้ว

การสร้างภาพข้อมูลแบบอินเทอร์แอกทีฟด้วย Bokeh

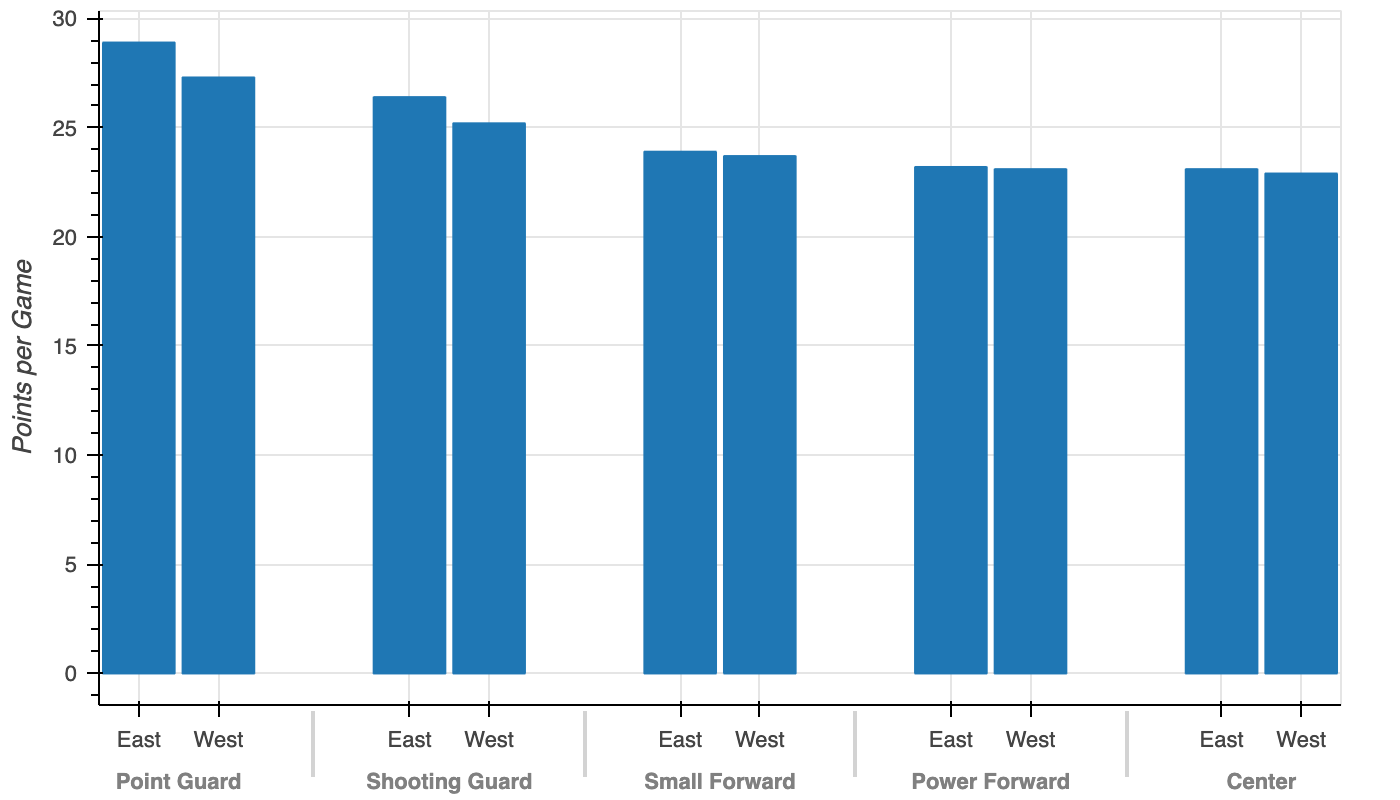
หมวดหมู่แบบซ้อนกัน

positions = ["Point Guard", "Shooting Guard", 
            "Small Forward", "Power Forward", "Center"]
conferences = ["East", "West"]

factors = [("Point Guard", "East"), ("Point Guard", "West"), ("Shooting Guard", "East"), ("Shooting Guard", "West"), ("Small Forward", "East"), ("Small Forward", "West"), ("Power Forward", "East"), ("Power Forward", "West"), ("Center", "East"), ("Center", "West")]
การสร้างภาพข้อมูลแบบอินเทอร์แอกทีฟด้วย Bokeh

สร้างกราฟแท่งแบบกลุ่ม

from bokeh.models import FactorRange

fig = figure(x_range=FactorRange(*factors), y_axis_label="Points per Game")
fig.vbar(x=factors, top=nba["points"], width=0.9)
output_file(filename="grouped_bar_plot.html") show(fig)
การสร้างภาพข้อมูลแบบอินเทอร์แอกทีฟด้วย Bokeh

กราฟแท่งแบบกลุ่ม

กราฟแท่งแบบกลุ่ม

การสร้างภาพข้อมูลแบบอินเทอร์แอกทีฟด้วย Bokeh

มาฝึกกันเถอะ!

การสร้างภาพข้อมูลแบบอินเทอร์แอกทีฟด้วย Bokeh

Preparing Video For Download...