การวัดประโยชน์ที่ได้รับ
การเขียนโปรแกรมแบบขนานใน R

Nabeel Imam
Data Scientist
ตัวอย่างเบื้องต้น
numbers <- 1:1000000# Sequential sqroots <- lapply(numbers, sqrt)# Parallel cl <- makeCluster(4) sqroots <- parLapply(cl, numbers, sqrt) stopCluster(my_cluster)
แบบไหนทำงานได้เร็วกว่า?
การวัดประสิทธิภาพ (Benchmarking)
รันโค้ดหลายครั้งเพื่อประมาณเวลาทำงานเฉลี่ย
library(microbenchmark)microbenchmark( "Sequential" = lapply(numbers, sqrt),"Parallel" = { cl <- makeCluster(4) parLapply(cl, numbers, sqrt) stopCluster(my_cluster) },times = 10 )
Unit: milliseconds
      expr     min    mean     max neval
Sequential  633.96  838.09  993.59    10
  Parallel 1136.95 1247.29 1557.58    10
- การคำนวณตัวเลขอย่างง่ายแทบไม่ได้ประโยชน์จากการประมวลผลแบบขนาน
- การ profiling ให้รายงานทีละบรรทัด ส่วน benchmarking ให้เวลารันโดยรวม
สิ่งที่ถูกมองข้าม
sqroots <- sqrt(numbers)

Vectorization
sqroots <- sqrt(numbers)
- ฟังก์ชันใน Base R เช่น
sqrt()รองรับการทำงานแบบ vectorized - ส่งฟังก์ชันเดียวไปยังหลาย input พร้อมกัน
- เร็วมาก แต่ใช้ได้กับการคำนวณอย่างง่ายเท่านั้น
microbenchmark(
  "Vectorized" = sqrt(numbers),
  "Sequential" = lapply(numbers, sqrt),
  "Parallel" = {
    cl <- makeCluster(4)
    parLapply(cl, numbers, sqrt)
    stopCluster(my_cluster)
  },
  times = 10)
Unit: milliseconds
      expr       min      mean      max neval
Vectorized    2.3904    9.2071   66.303    10
Sequential  352.1166  771.7491 1004.753    10
  Parallel 1191.3176 1377.6926 1700.316    10
Bootstrap
สุ่มตัวอย่างจากข้อมูลปัจจุบันแบบ with replacement
print(ls_df)
$`2001`
   Country             Life_expectancy  Year
 1 Afghanistan                    56.3  2001
 2 Albania                        74.3  2001
 3 Algeria                        71.1  2001
...
$`2002`
   Country             Life_expectancy  Year
 1 Afghanistan                    56.8  2002
 2 Albania                        74.6  2002
 3 Algeria                        71.6  2002
...
แบบดั้งเดิม
df <- ls_df$`2001`estimates <- rep(0, 10000)for (i in 1:10000) { b <- sample(df$Life_expectancy, replace = T)estimates[i] <- mean(b) }
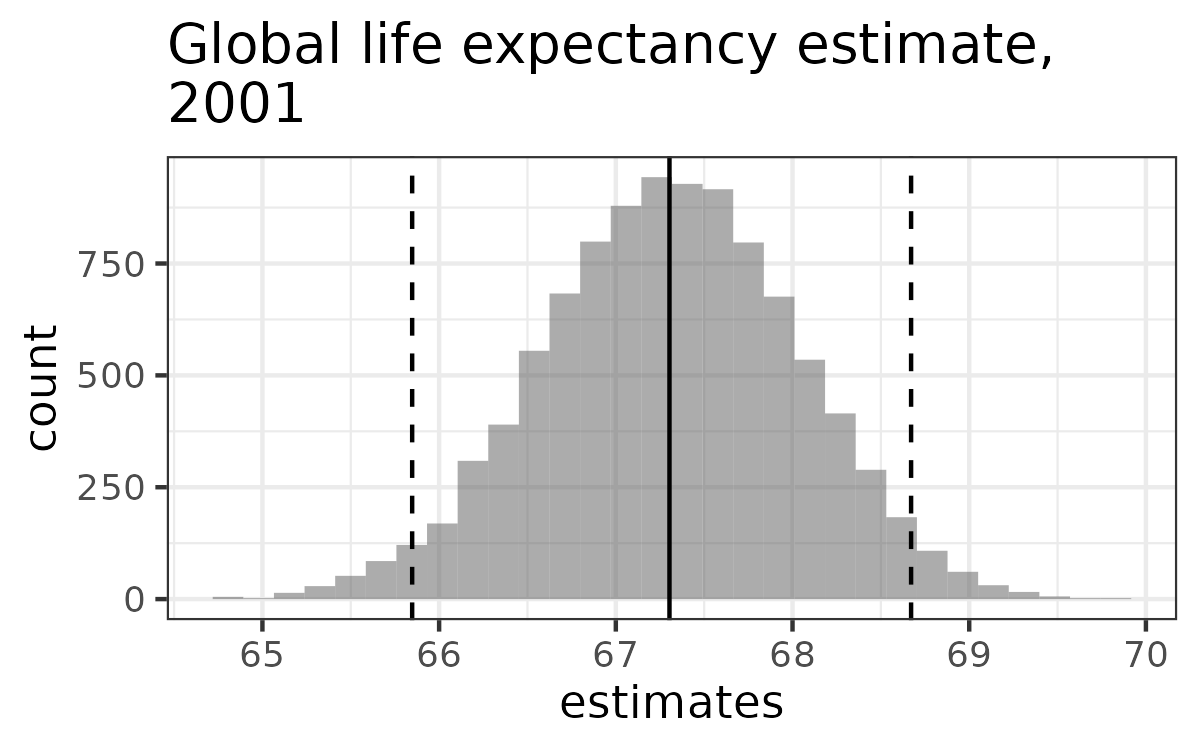
- คำนวณ confidence interval ด้วย quantile:
quantile(estimates, c(0.025, 0.975))
ข่าวดี
Bootstrap สามารถทำแบบขนานได้
estimates <- rep(0, 10000)

for (i in 1:10000) {

  b <- sample(df$Life_expectancy,
              replace = T)

  estimates[i] <- mean(b)
  }
boot_dist <- function (df) { estimates <- rep(0, 10000) for (i in 1:10000) { b <- sample(df$Life_expectancy, replace = T) estimates[i] <- mean(b) } return(estimates) }cl <- makeCluster(4) ls_dists <- parLapply(cl, ls_df, boot_dist) stopCluster(cl)
ประโยชน์ที่ได้รับ
microbenchmark(
  "lapply" = lapply(ls_df, boot_dist),
  "parLapply" = {
    cl <- makeCluster(4)
    parLapply(cl, ls_df, boot_dist)
    stopCluster(cl)
  },
  times = 10
)
Unit: seconds
     expr    min   mean    max neval
   lapply 3.6938 4.2184 4.5267    10
parLapply 1.9006 2.5166 2.7292    10
ขั้นตอนในการทำ:
- วิเคราะห์โค้ดที่มีอยู่ ระบุส่วนที่ช้าที่สุด
- ทำให้ขั้นตอนนั้นเป็นแบบขนานหรือปรับปรุงให้ดีขึ้น
- วัดและเปรียบเทียบผลลัพธ์
มาฝึกกันเถอะ!
การเขียนโปรแกรมแบบขนานใน R

