Märkta anomalier

Introduktion till avvikelsedetektering i R

Alastair Rushworth

Data Scientist

Satellitbildsdata

head(sat, 5)
  label V1  V2  V3 V4 V5
1     0 92 115 120 94 84
2     0 84 102 106 79 84
3     0 84 102 102 83 80
4     0 80 102 102 79 84
5     0 84  94 102 79 80
Introduktion till avvikelsedetektering i R

Satellitbildsdata

table(sat$label)
   0    1 
5732   71

Andel bomullsgrödor i bilderna:

71 / 5803
0.01223505
Introduktion till avvikelsedetektering i R

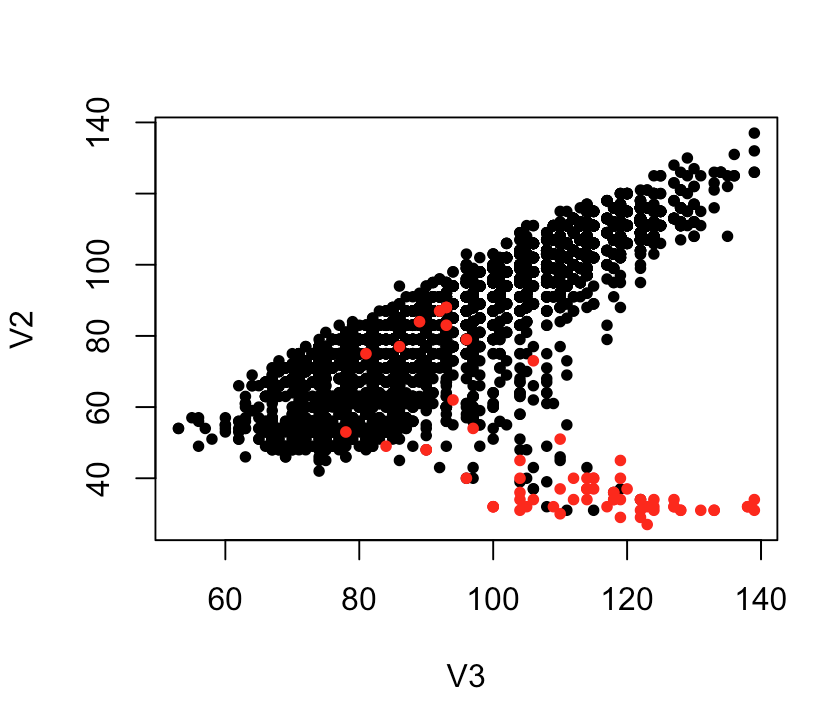
Visualisera verkliga anomalier

plot(V2 ~ V3, data = sat, col = as.factor(label), pch = 20)
Introduktion till avvikelsedetektering i R

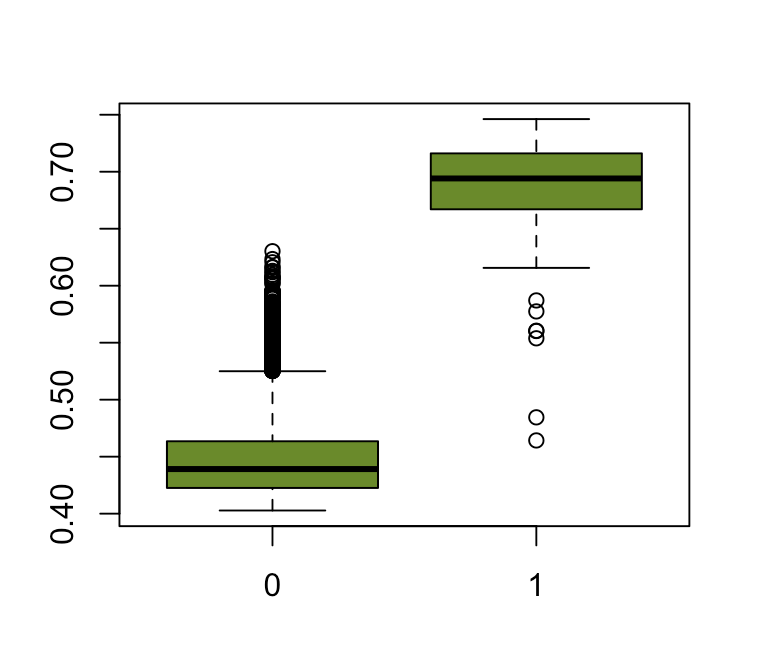
Anomalipoäng jämfört med faktisk etikett

sat_for <- iForest(sat[, -1], nt = 100)
sat$score <- predict(sat_for, features)

boxplot(score ~ label, data = sat, col = "olivedrab4")
Introduktion till avvikelsedetektering i R

Varför inte använda modeller för att förutsäga etiketter?

Exempel 1: Identifiering av sällsynta sjukdomsfall

  • För få fall


Exempel 2: Kreditkortsbedrägeri

  • Förändras snabbt
Introduktion till avvikelsedetektering i R

Nu kör vi en övning!

Introduktion till avvikelsedetektering i R

Preparing Video For Download...