การเชื่อมโยงสองชาร์ต

การสร้างภาพข้อมูลเชิงโต้ตอบด้วย plotly ใน R ระดับกลาง

Adam Loy

Statistician, Carleton College

สำรวจกลุ่มข้อมูล
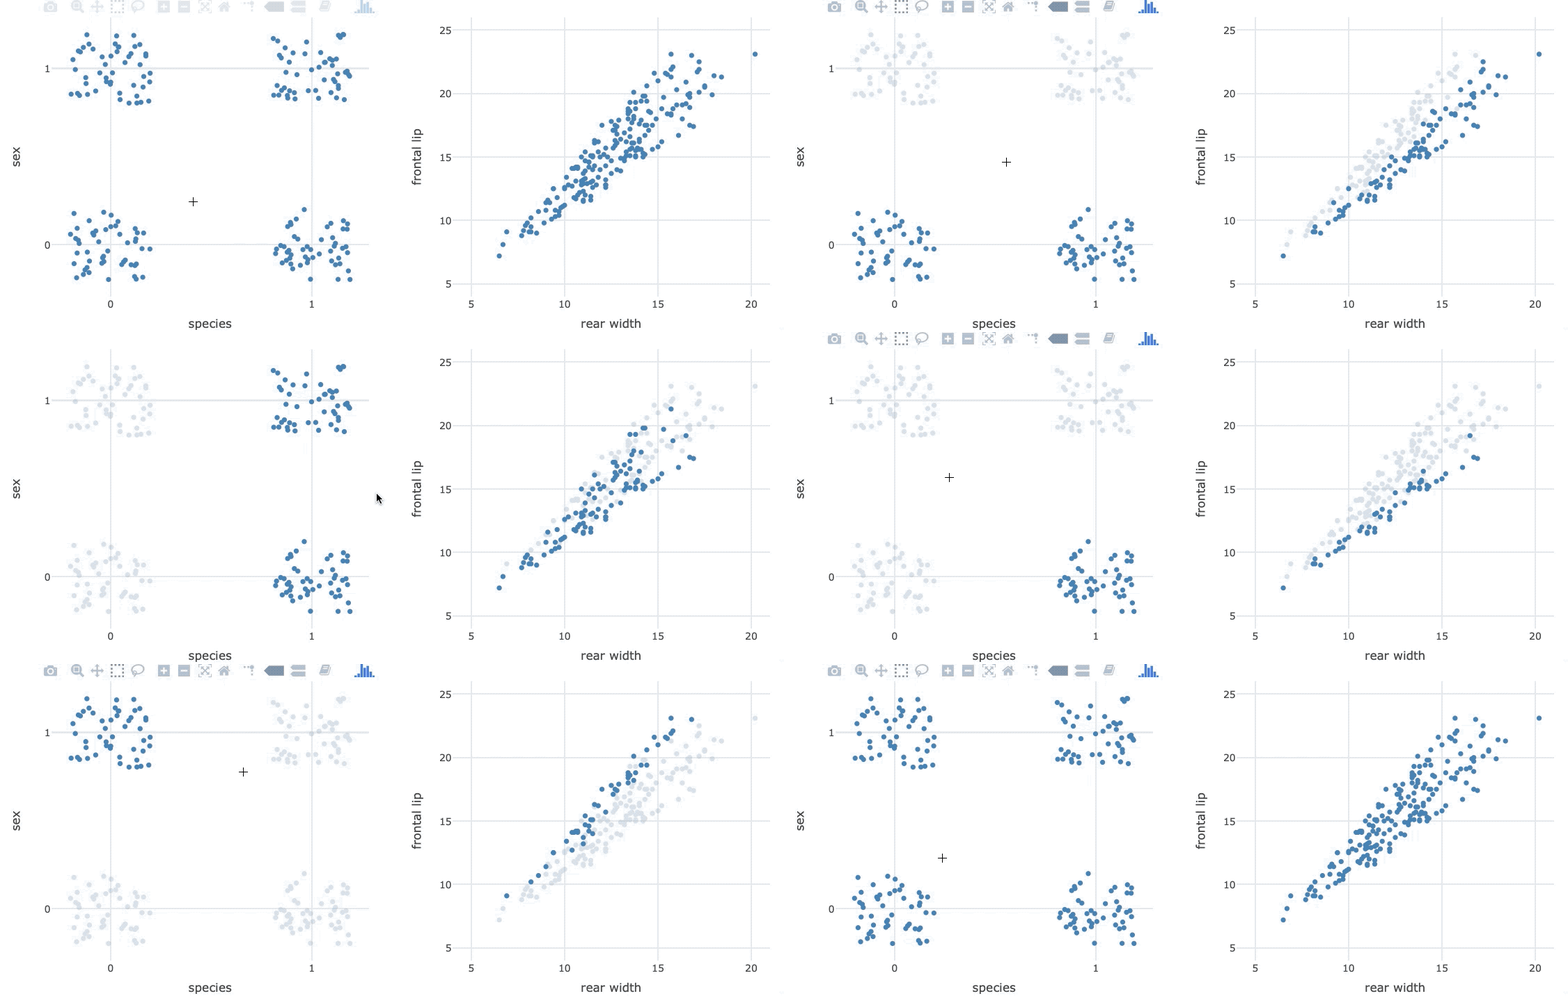
motivate_linked_brushing.gif

การสร้างภาพข้อมูลเชิงโต้ตอบด้วย plotly ใน R ระดับกลาง

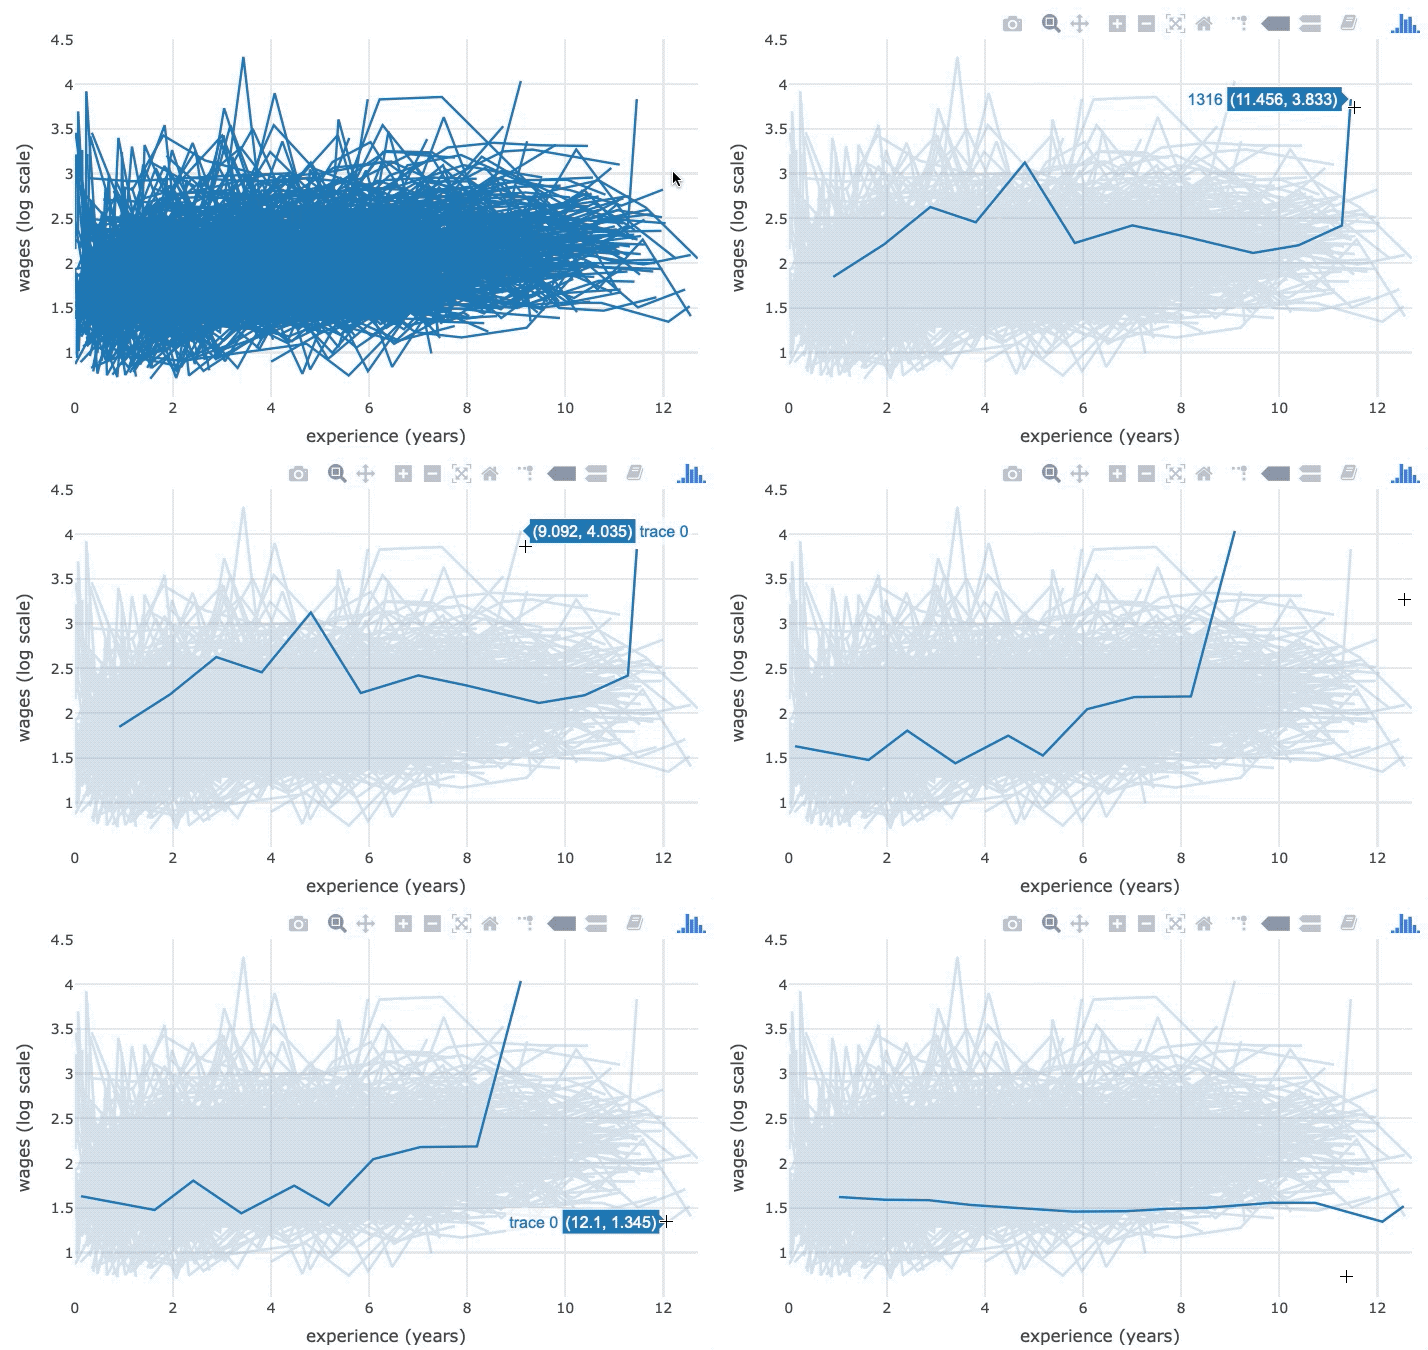
สำรวจข้อมูลตามช่วงเวลา

motivate_timeseries_highlight.gif

การสร้างภาพข้อมูลเชิงโต้ตอบด้วย plotly ใน R ระดับกลาง

Crosstalk

  • เชื่อมโยงพล็อตผ่าน JavaScript
  • สร้างไฟล์ HTML แบบ static ที่โฮสต์ได้ง่าย
  • แสดงผลในแผง RStudio viewer
การสร้างภาพข้อมูลเชิงโต้ตอบด้วย plotly ใน R ระดับกลาง

ตัวชี้วัดโลกปี 2014

world2014
# A tibble: 193 x 11
  country  year income   co2 military population  urban life_expectancy four_regions
  <chr>   <dbl>  <dbl> <dbl>    <dbl>      <dbl>  <dbl>           <dbl> <chr>       
1 Afghan…  2014   1780 0.299     1.3    32800000 8.05e6            57.8 asia        
2 Albania  2014  10700 1.96      1.35    2920000 1.63e6            77.4 europe      
3 Algeria  2014  13500 3.72      5.55   39100000 2.75e7            77.1 africa      
4 Andorra  2014  44900 5.83     NA         79200 7.01e4            82.6 europe      
5 Angola   2014   6260 1.29      4.7    26900000 1.69e7            63.3 africa      
6 Antigu…  2014  19500 5.38     NA         98900 2.49e4            77.1 americas    
# … with 187 more rows, and 2 more variables: eight_regions <chr>, six_regions <chr>
การสร้างภาพข้อมูลเชิงโต้ตอบด้วย plotly ใน R ระดับกลาง

มุมมองแยกกัน

not-linked.gif

p1 <- world2014 %>% plot_ly(x = ~income, y = ~co2) %>% add_markers()
p2 <- world2014 %>% plot_ly(x = ~military, y = ~co2) %>% add_markers()
subplot(p1, p2, titleX = TRUE, titleY = TRUE) %>% 
  hide_legend()
การสร้างภาพข้อมูลเชิงโต้ตอบด้วย plotly ใน R ระดับกลาง

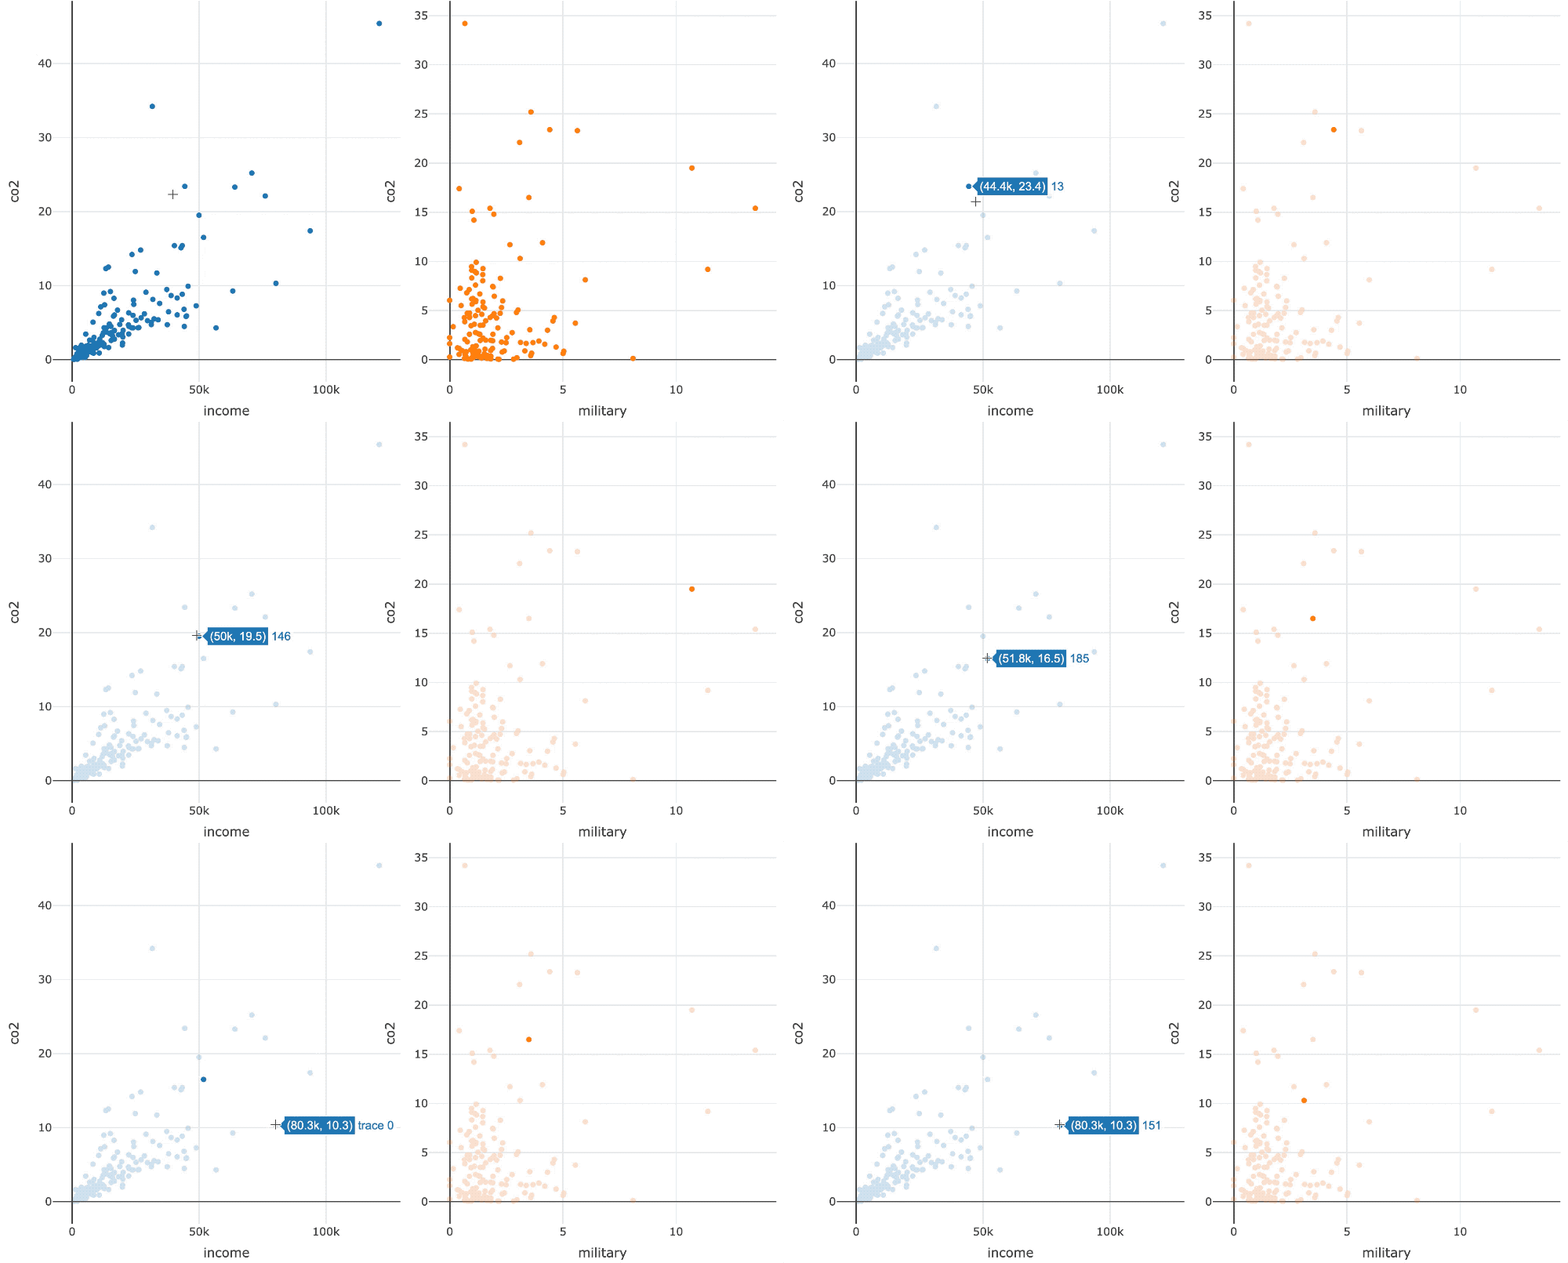
มุมมองที่เชื่อมโยงกัน

linked_points.gif

การสร้างภาพข้อมูลเชิงโต้ตอบด้วย plotly ใน R ระดับกลาง

มุมมองที่เชื่อมโยงกัน

library(crosstalk)
shared_data <- SharedData$new(world2014)

p1 <- shared_data %>% plot_ly(x = ~income, y = ~co2) %>% add_markers() p2 <- shared_data %>% plot_ly(x = ~military, y = ~co2) %>% add_markers()
subplot(p1, p2, titleX = TRUE, titleY = TRUE) %>% hide_legend()
การสร้างภาพข้อมูลเชิงโต้ตอบด้วย plotly ใน R ระดับกลาง

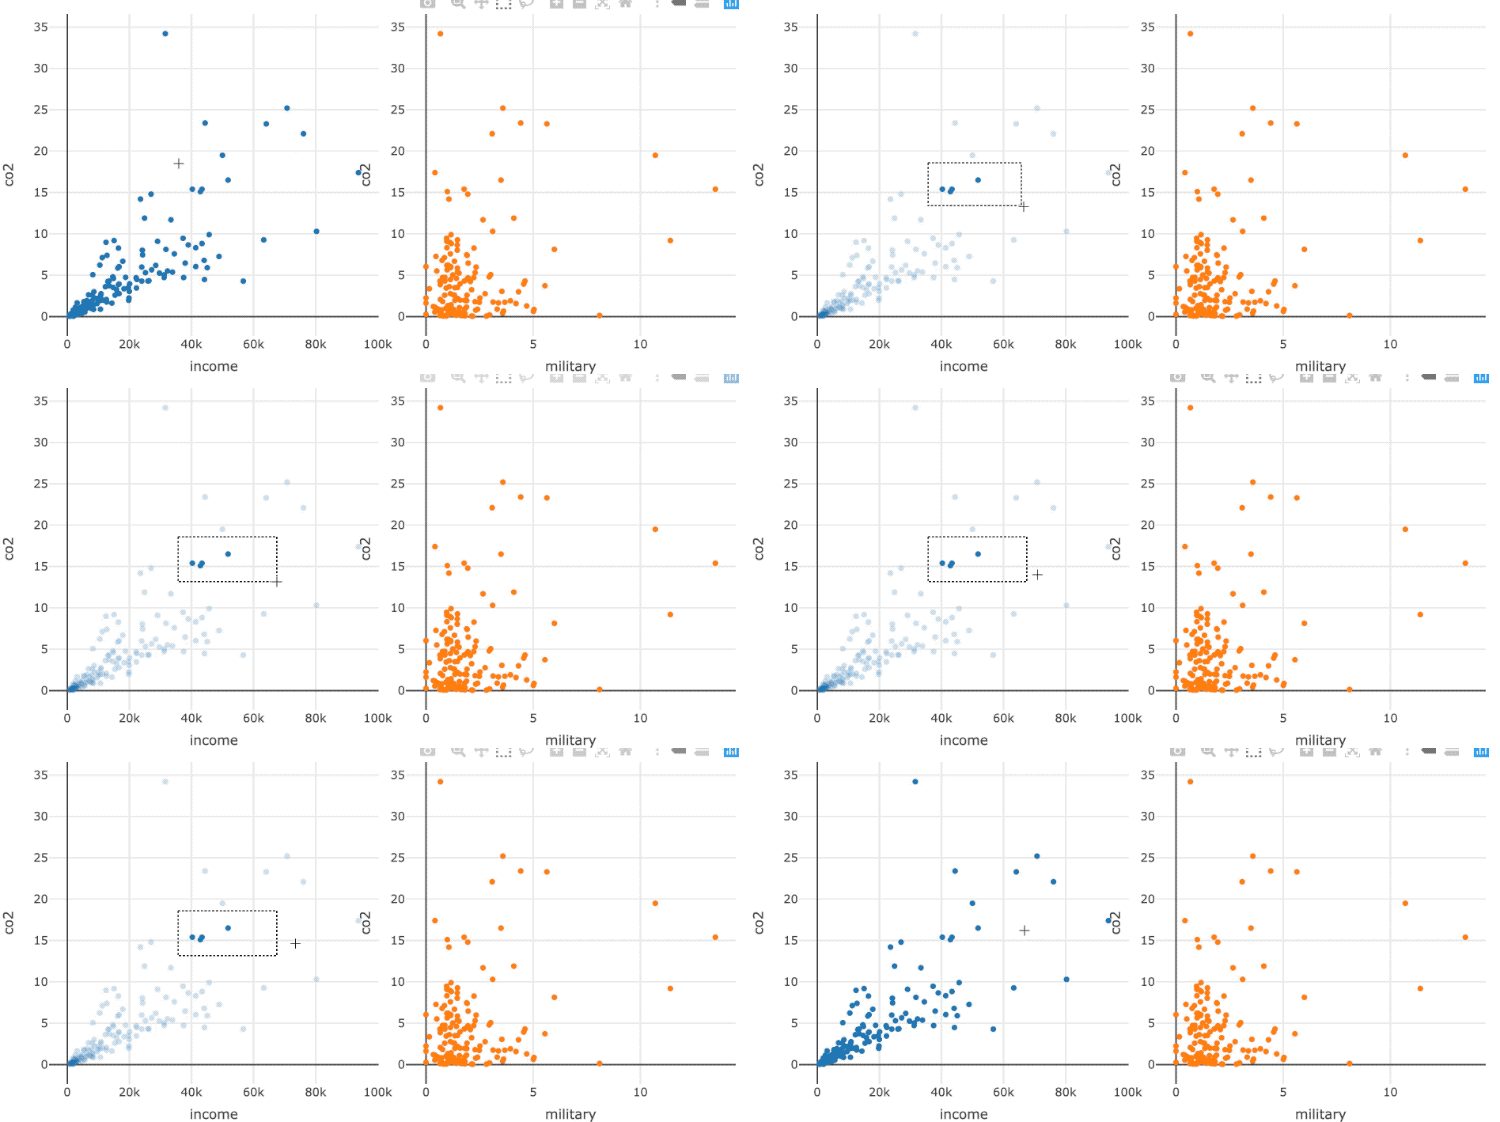
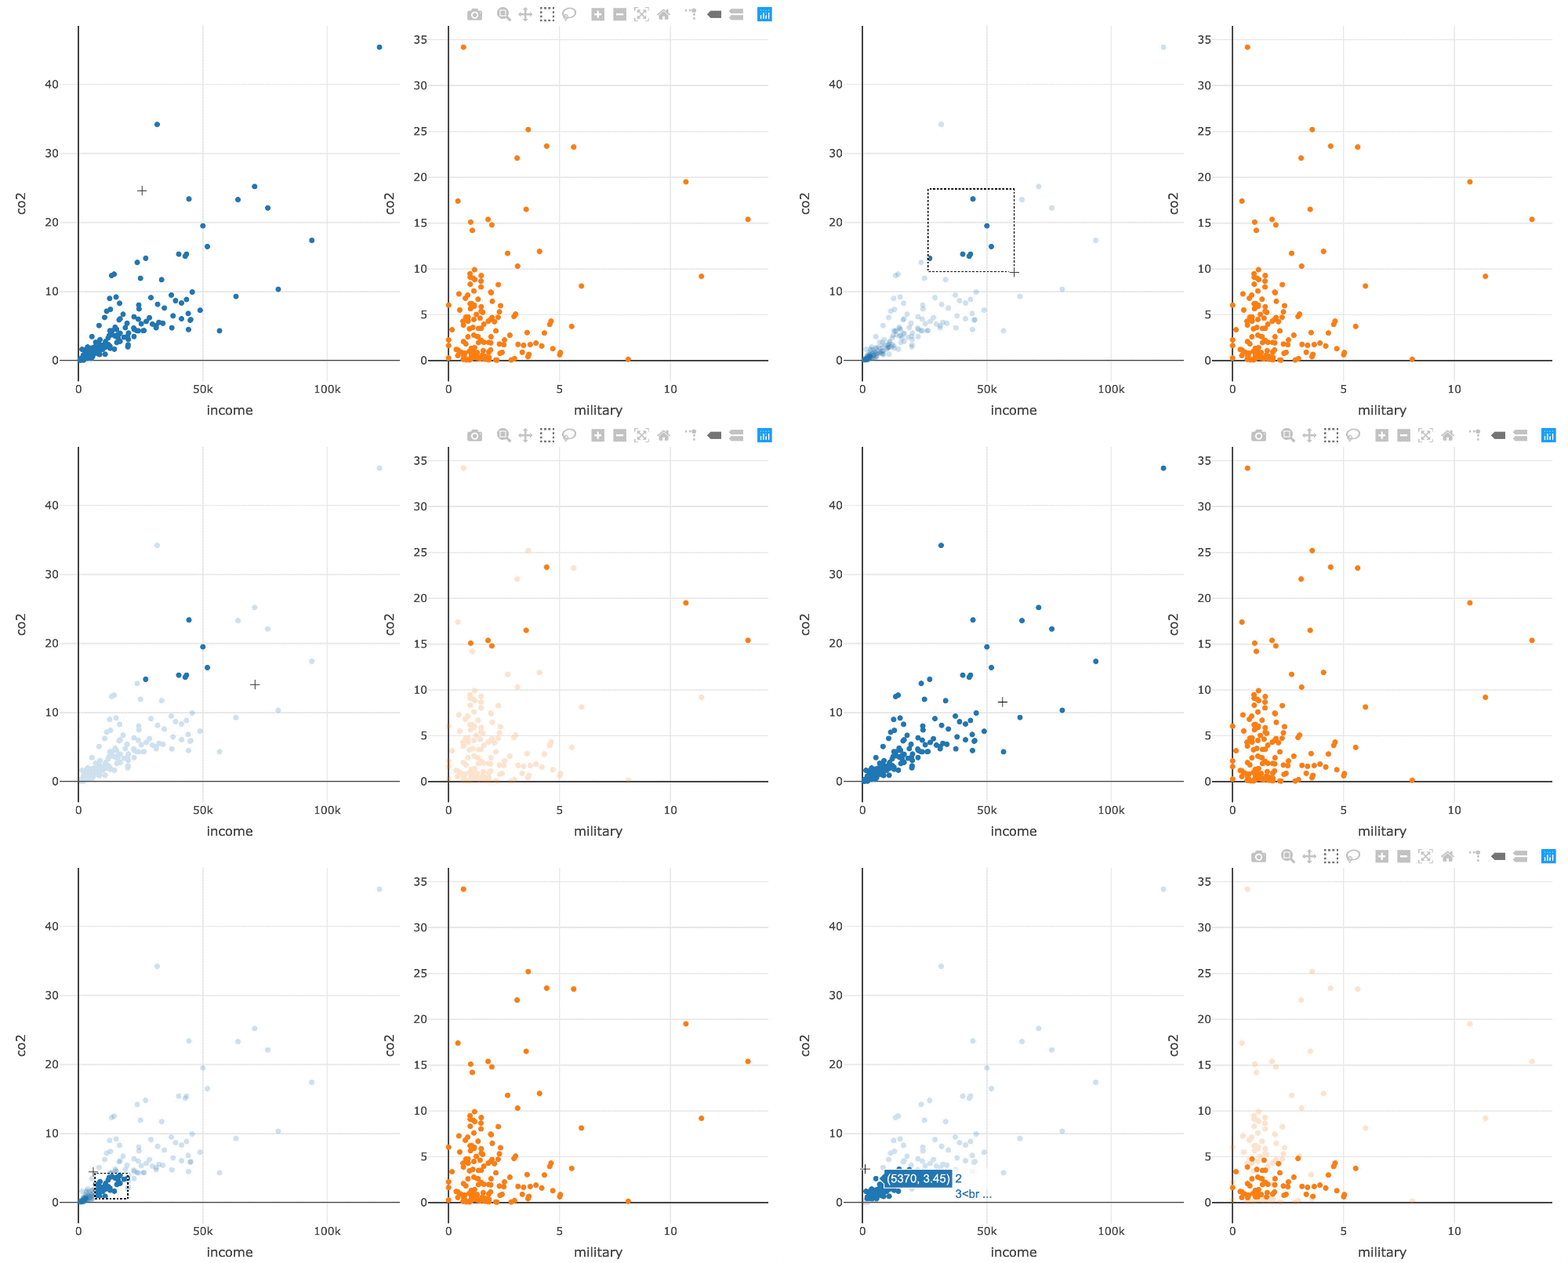
Linked brushing

linked_brushing.gif

เปิดใช้ linked brushing ผ่าน highlight()

subplot(p1, p2, titleX = TRUE, titleY = TRUE) %>% 
  hide_legend() %>%
  highlight(on = "plotly_selected")
การสร้างภาพข้อมูลเชิงโต้ตอบด้วย plotly ใน R ระดับกลาง

มาฝึกกันเถอะ!

การสร้างภาพข้อมูลเชิงโต้ตอบด้วย plotly ใน R ระดับกลาง

Preparing Video For Download...