กลยุทธ์การเลือก

การสร้างภาพข้อมูลเชิงโต้ตอบด้วย plotly ใน R ระดับกลาง

Adam Loy

Statistician, Carleton College

กลยุทธ์การเลือก 2 แบบ
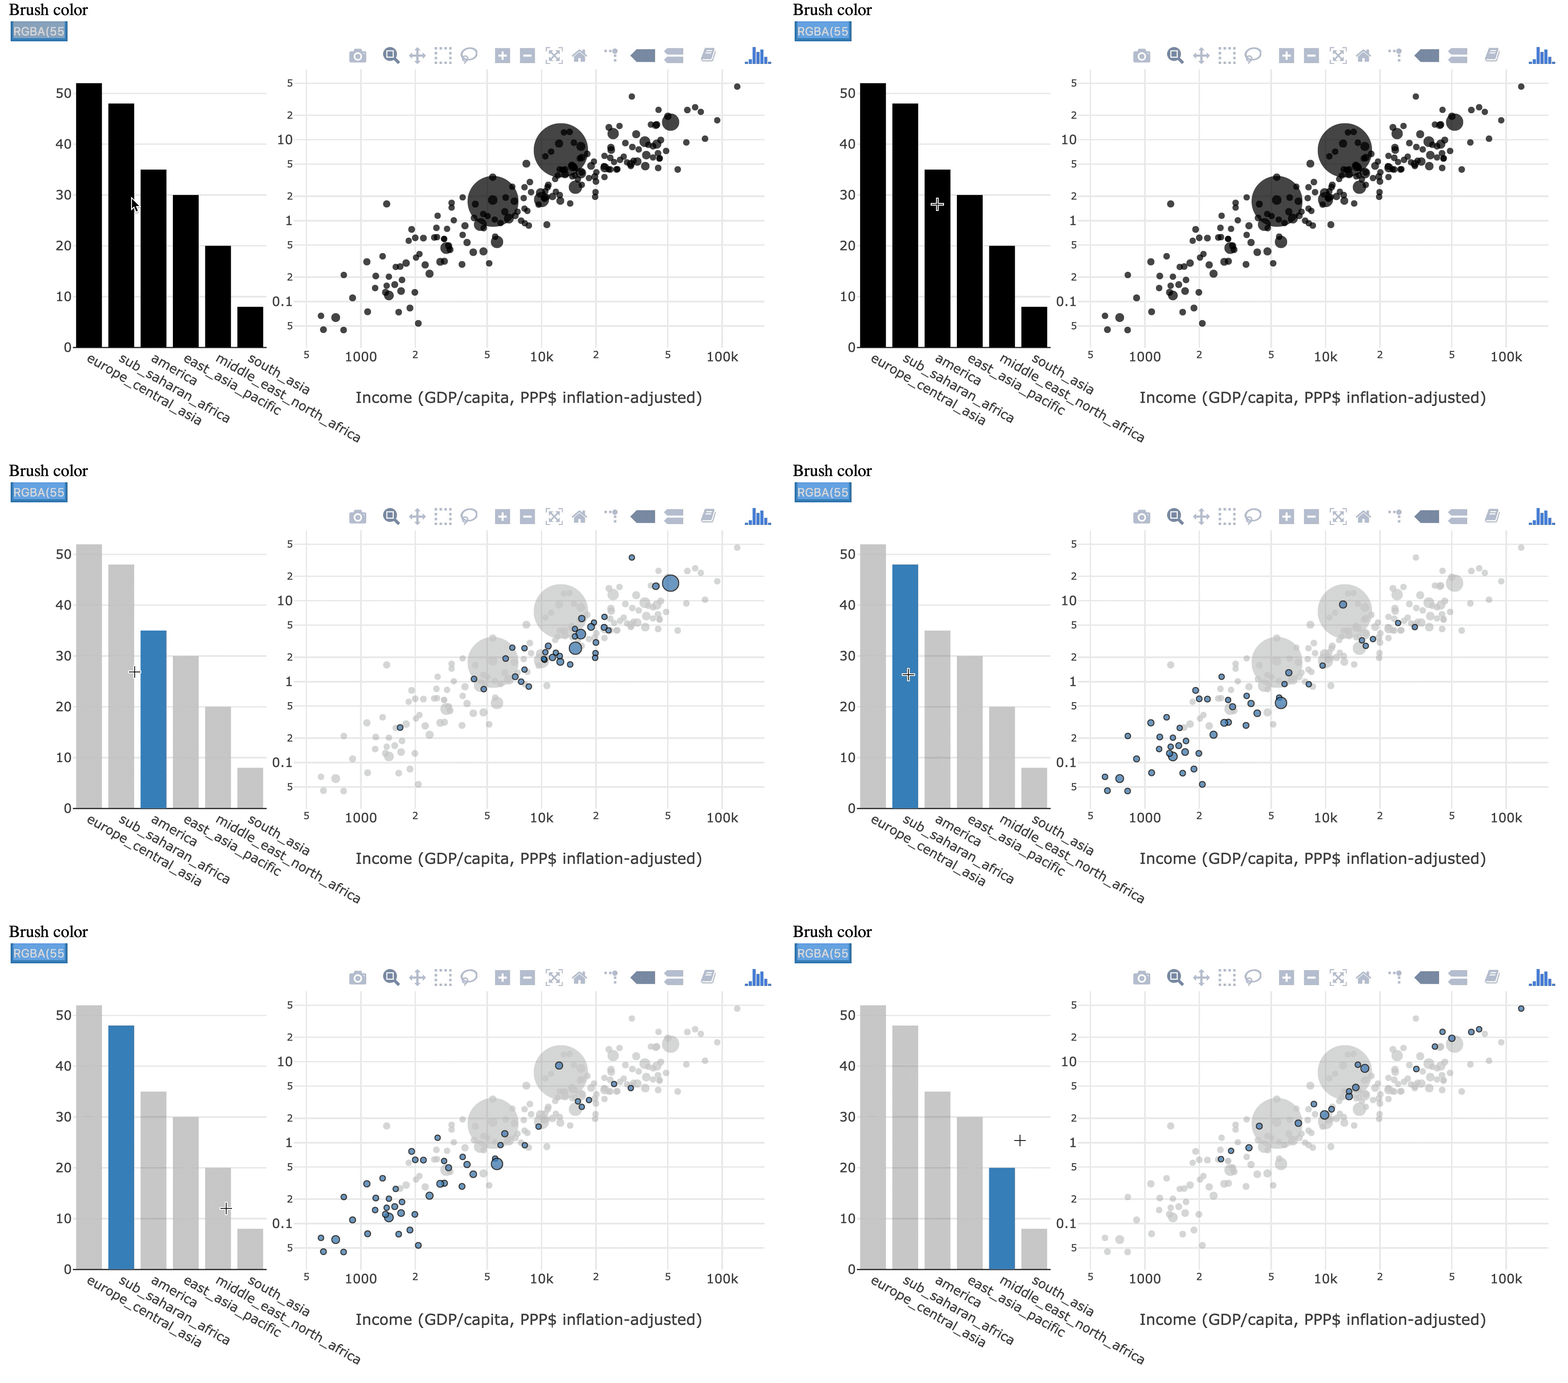
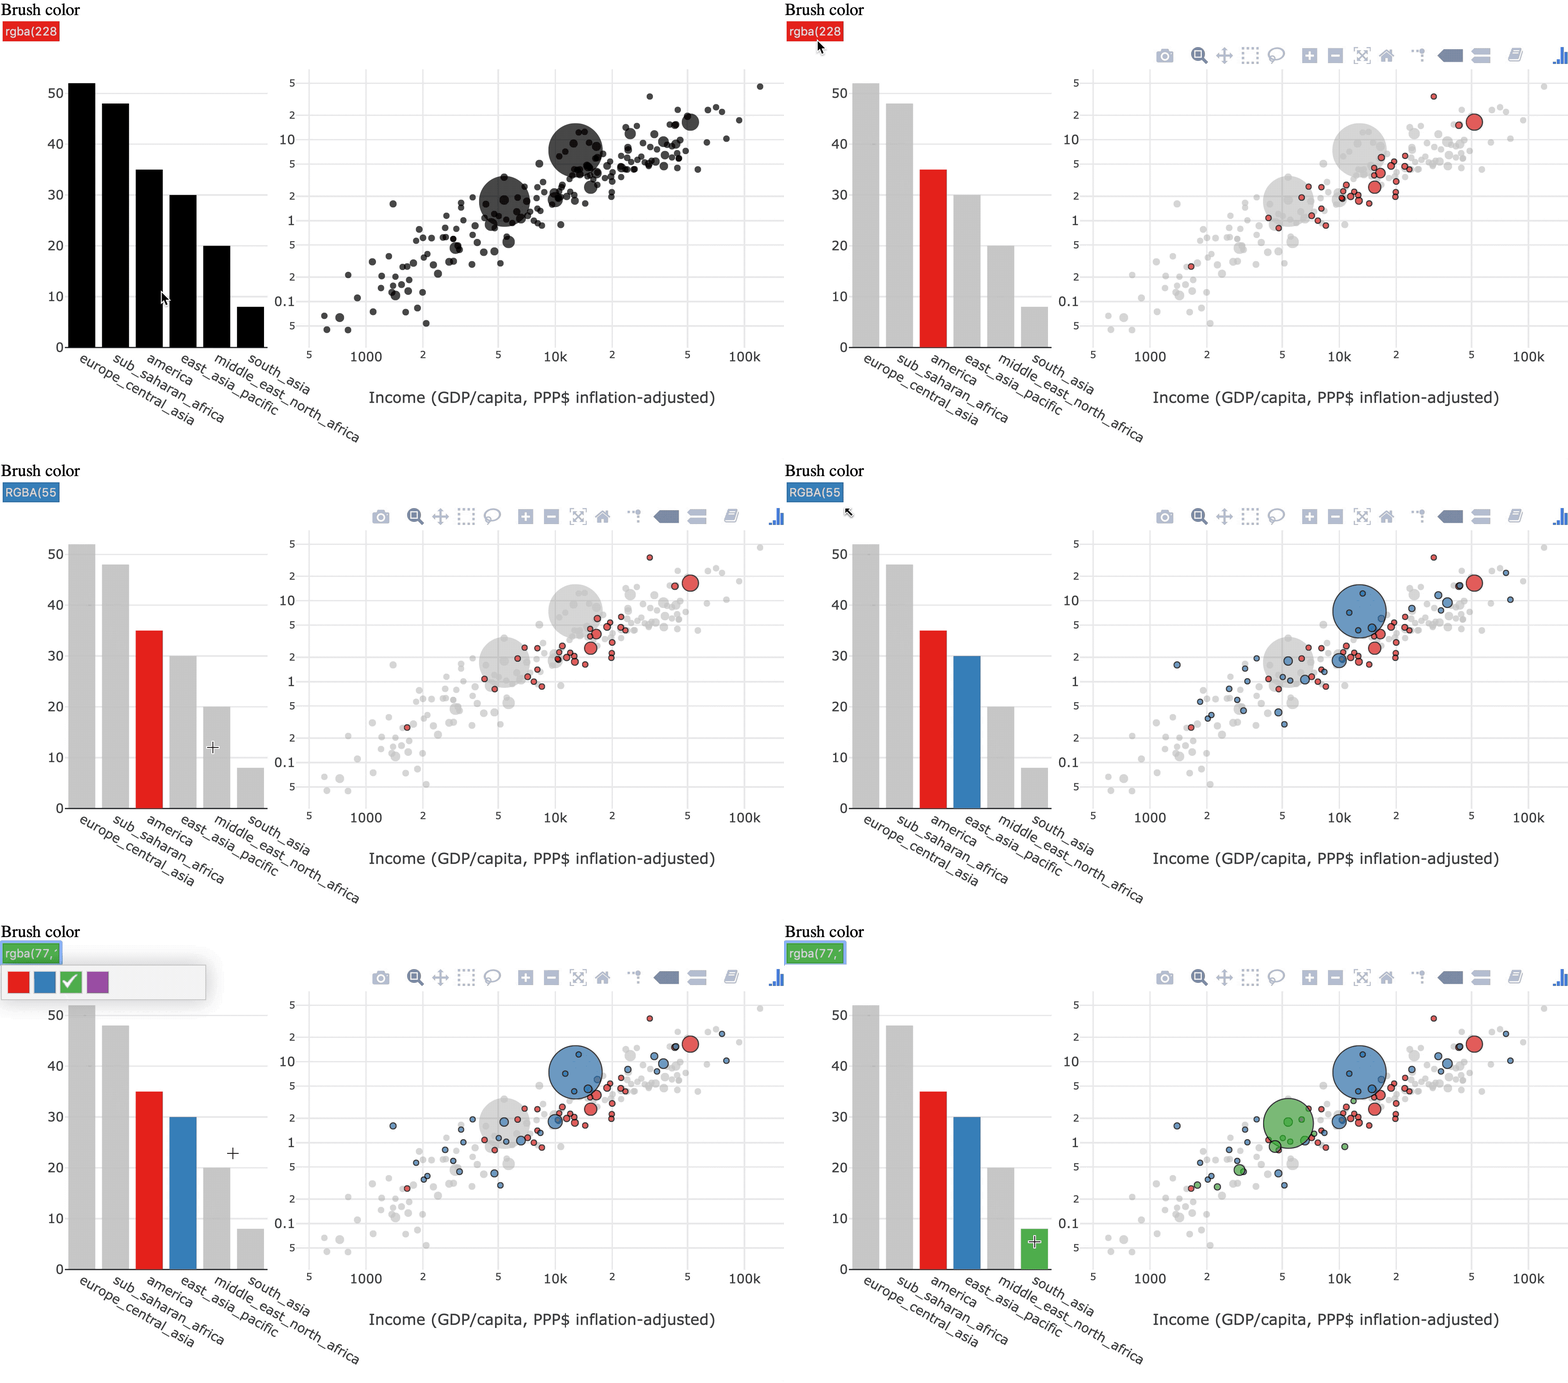
Transient selection

การเลือกก่อนหน้าจะถูกลืม

linking_teaser1.gif

Persistent selection

การเลือกจะสะสมต่อเนื่อง

linking_teaser2.gif

การสร้างภาพข้อมูลเชิงโต้ตอบด้วย plotly ใน R ระดับกลาง

ตัวอย่าง

before_persistent_selection.png

การสร้างภาพข้อมูลเชิงโต้ตอบด้วย plotly ใน R ระดับกลาง

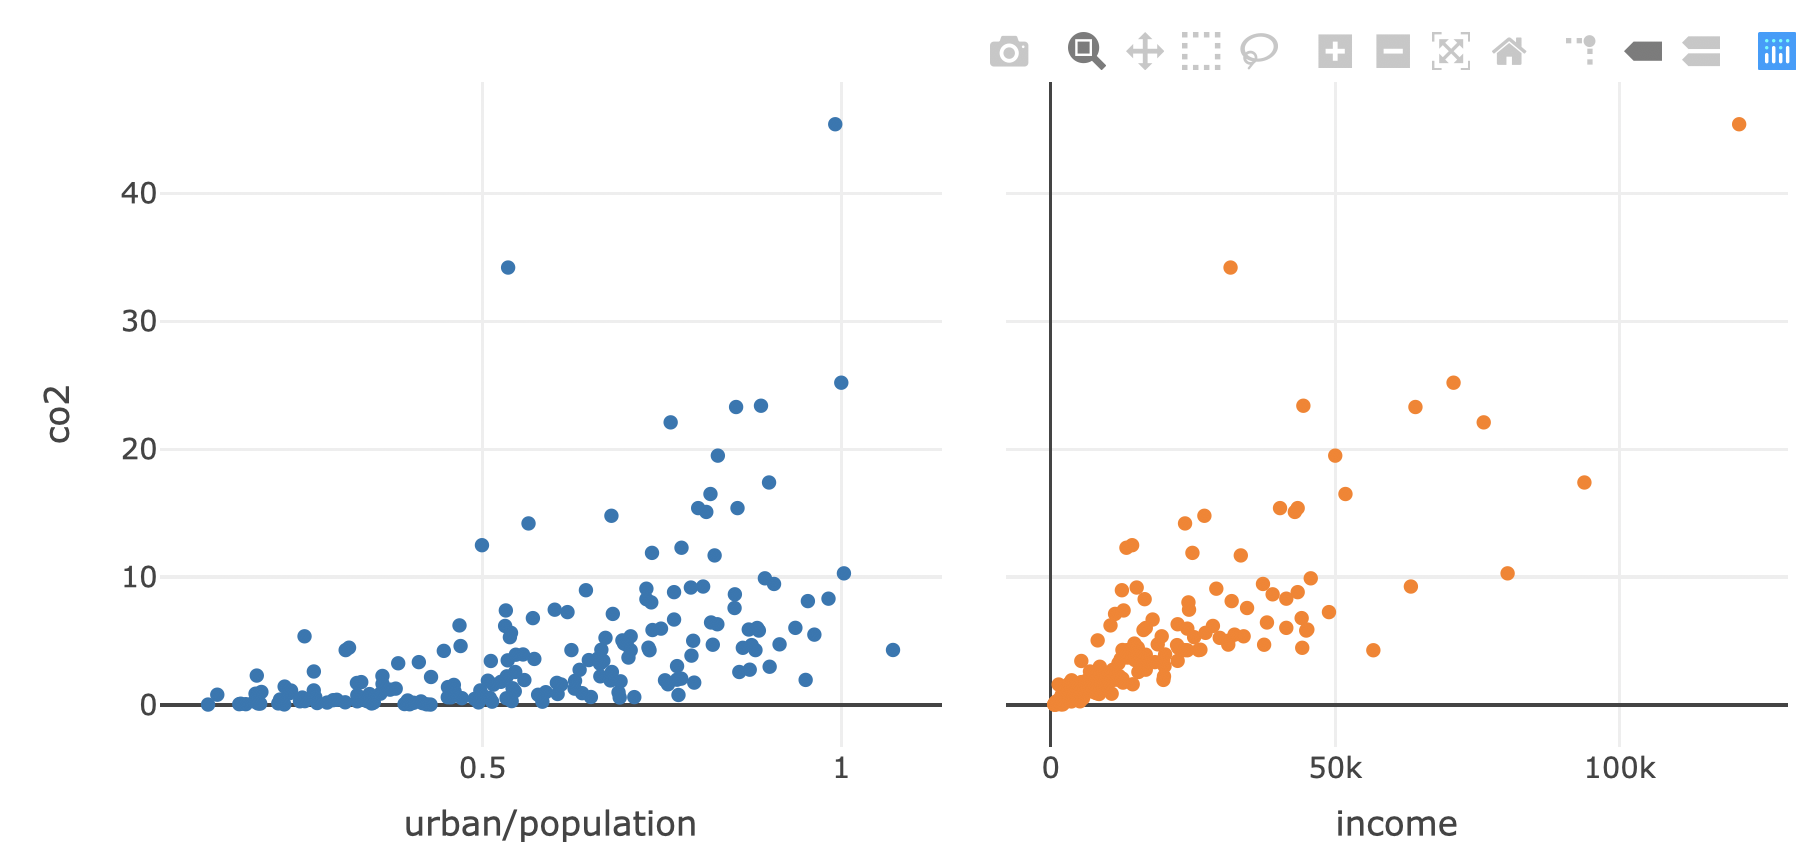
สร้างกราฟพื้นฐาน

shared_data <- world2014 %>% SharedData$new()

p1 <- shared_data %>%
  plot_ly(x=~urban/population, y = ~co2, text = ~country) %>%
  add_markers()

p2 <- shared_data %>%
  plot_ly(x=~income, y = ~co2, text = ~country) %>%
  add_markers()

subplot(p1, p2, titleX = TRUE, shareY = TRUE) %>% 
  hide_legend()
การสร้างภาพข้อมูลเชิงโต้ตอบด้วย plotly ใน R ระดับกลาง

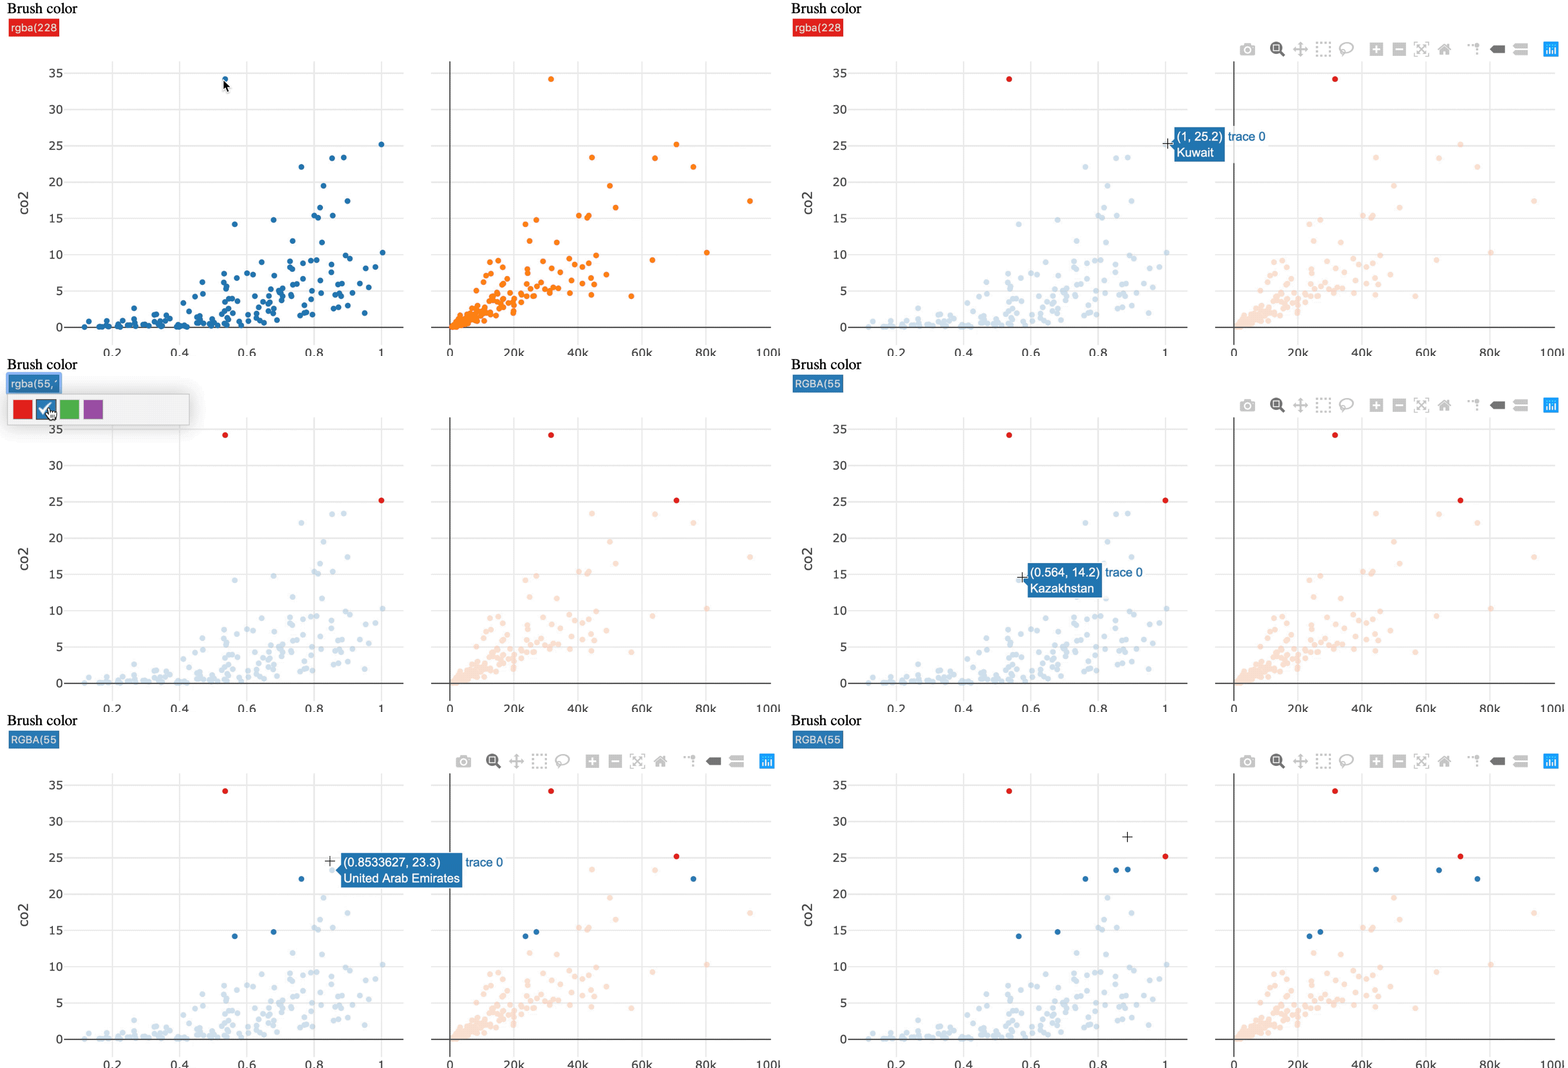
Persistent selection

เปิดใช้ persistent selection ผ่าน highlight()

subplot(p1, p2, titleX = TRUE, shareY = TRUE) %>% 
  hide_legend() %>%
  highlight(persistent = TRUE)
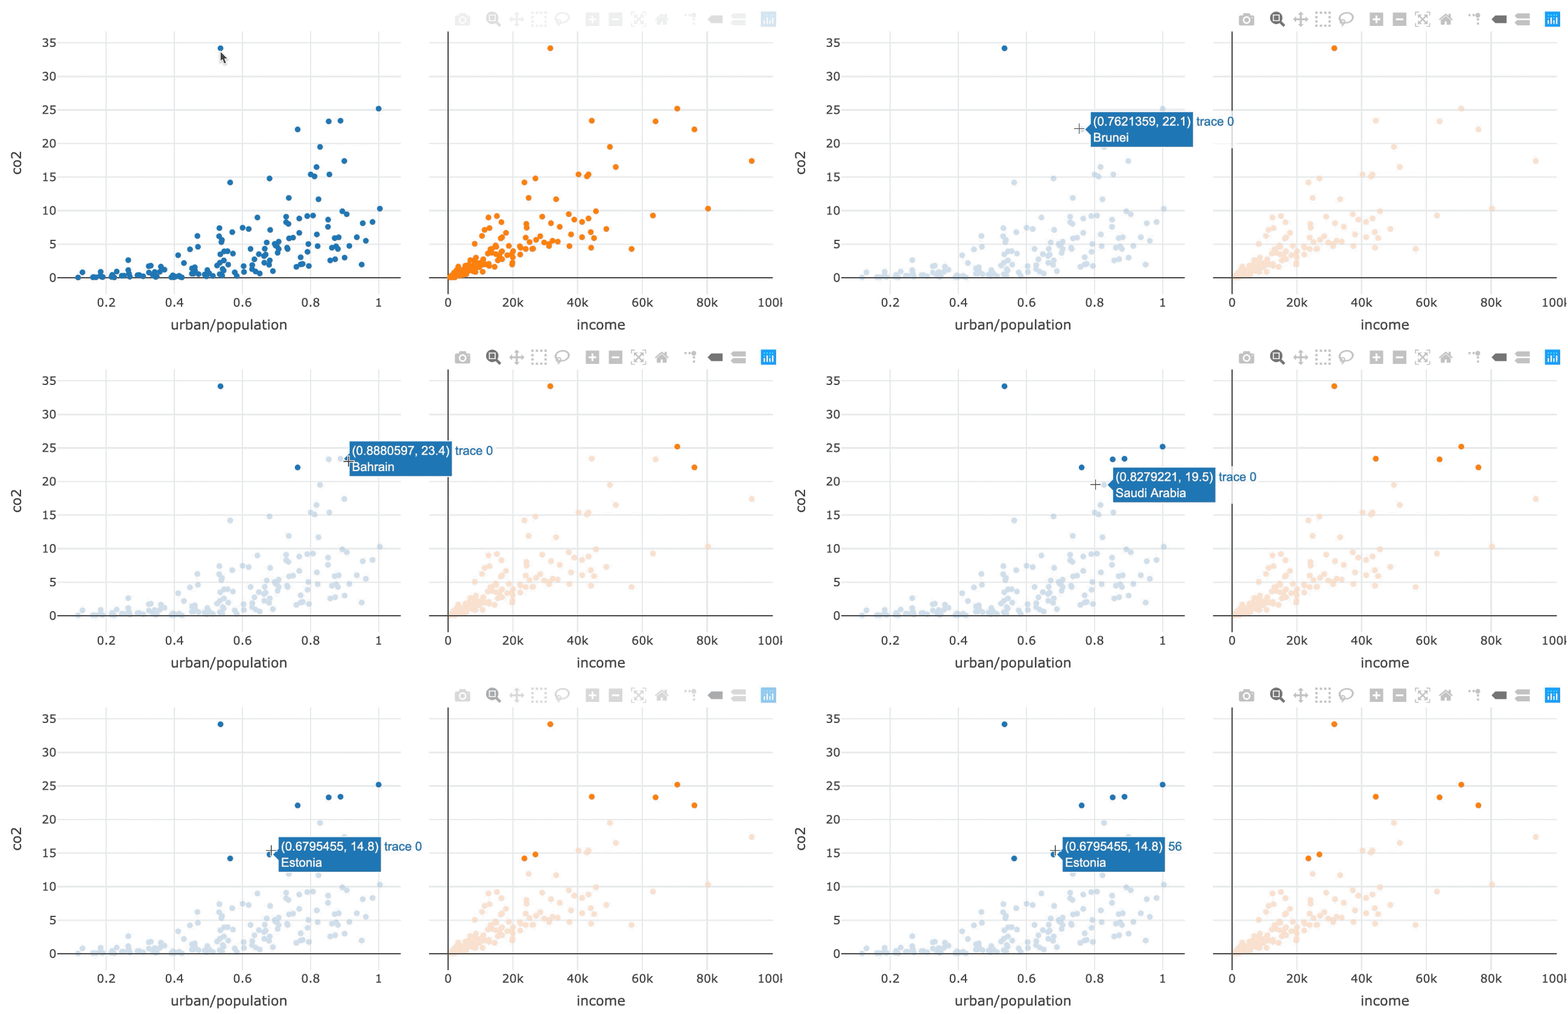
persistent_selection.gif

การสร้างภาพข้อมูลเชิงโต้ตอบด้วย plotly ใน R ระดับกลาง

การไฮไลต์ด้วยสี

dynamic_selection.gif

การสร้างภาพข้อมูลเชิงโต้ตอบด้วย plotly ใน R ระดับกลาง

การไฮไลต์ด้วยสี

เพิ่ม dynamic = TRUE เพื่อเปิดใช้ตัวเลือกสี

subplot(p1, p2, titleX = TRUE, shareY = TRUE) %>% 
  hide_legend() %>%
  highlight(persistent = TRUE, dynamic = TRUE)
การสร้างภาพข้อมูลเชิงโต้ตอบด้วย plotly ใน R ระดับกลาง

การจัดการ 2 ประเภท

Direct manipulation

เลือกโดยโต้ตอบกับองค์ประกอบในกราฟโดยตรง

linking_teaser1.gif

Indirect manipulation

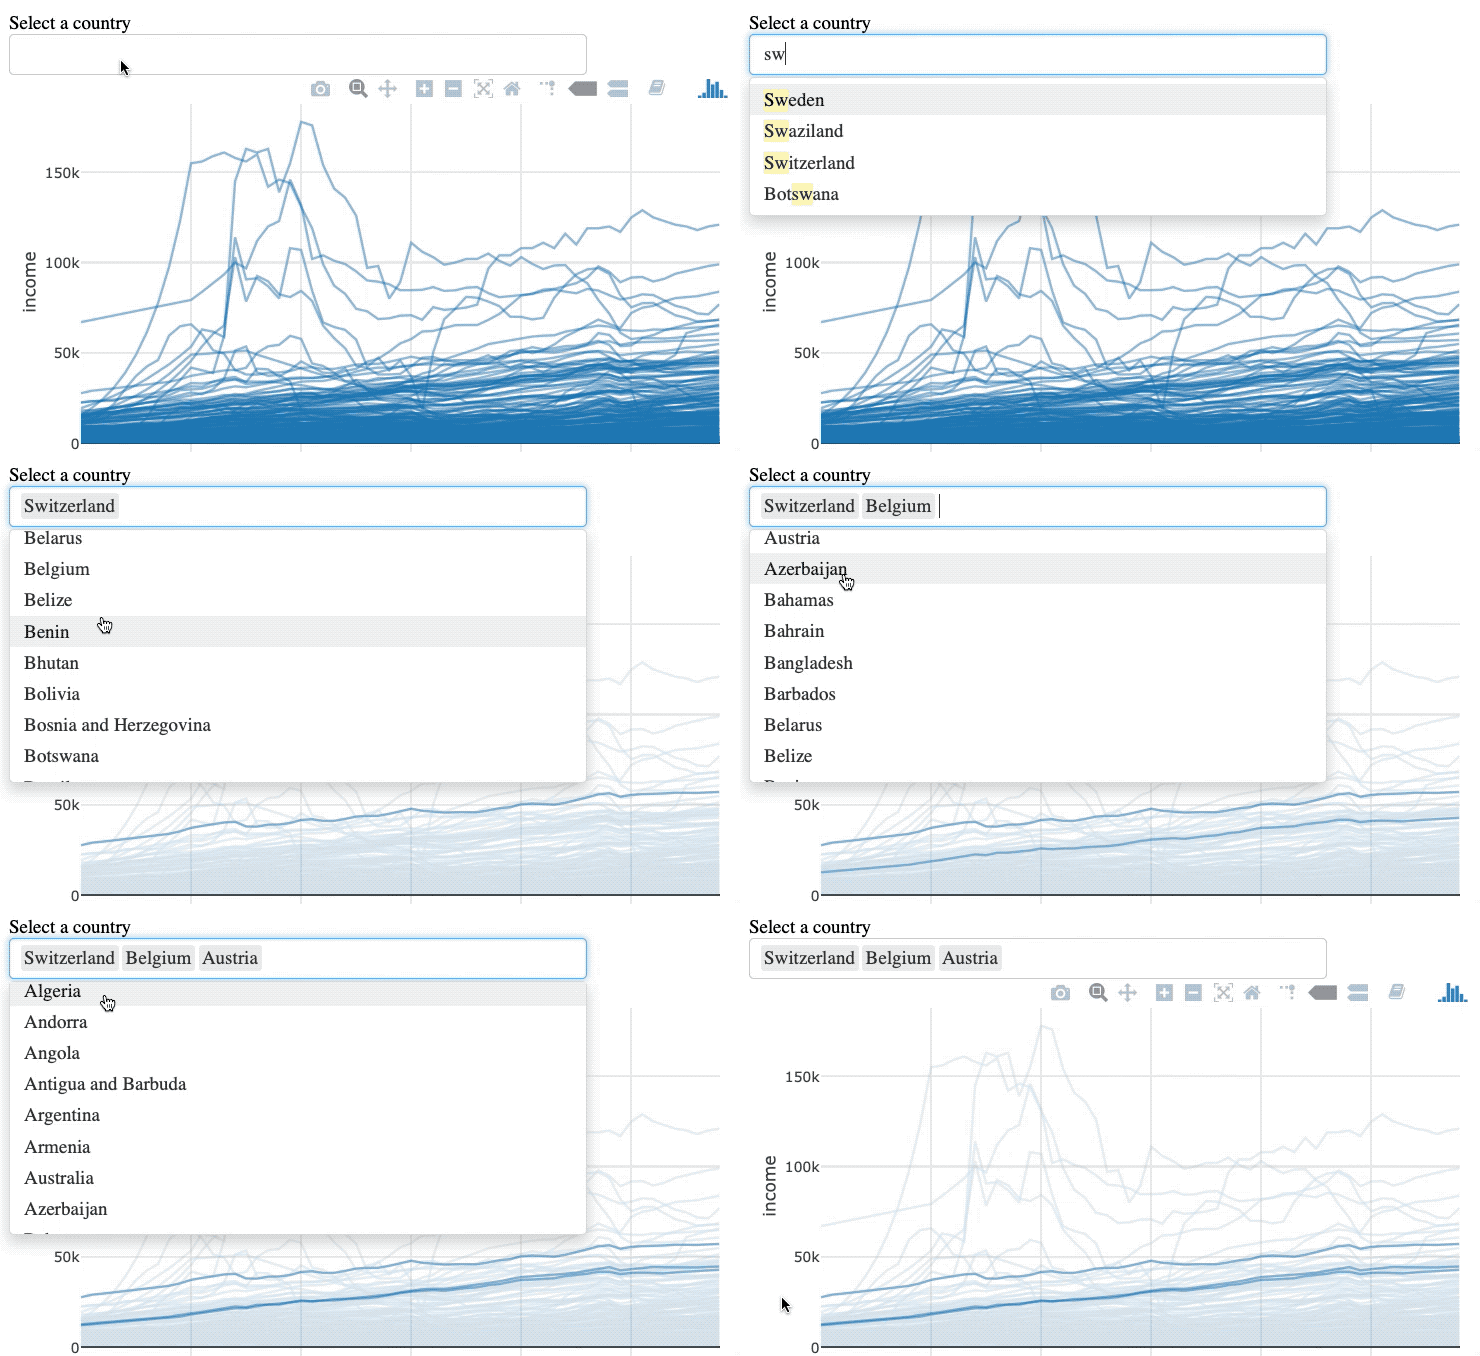
เลือกผ่านคิวรีที่อยู่นอกกราฟ

indirect_manipulation.gif

การสร้างภาพข้อมูลเชิงโต้ตอบด้วย plotly ใน R ระดับกลาง

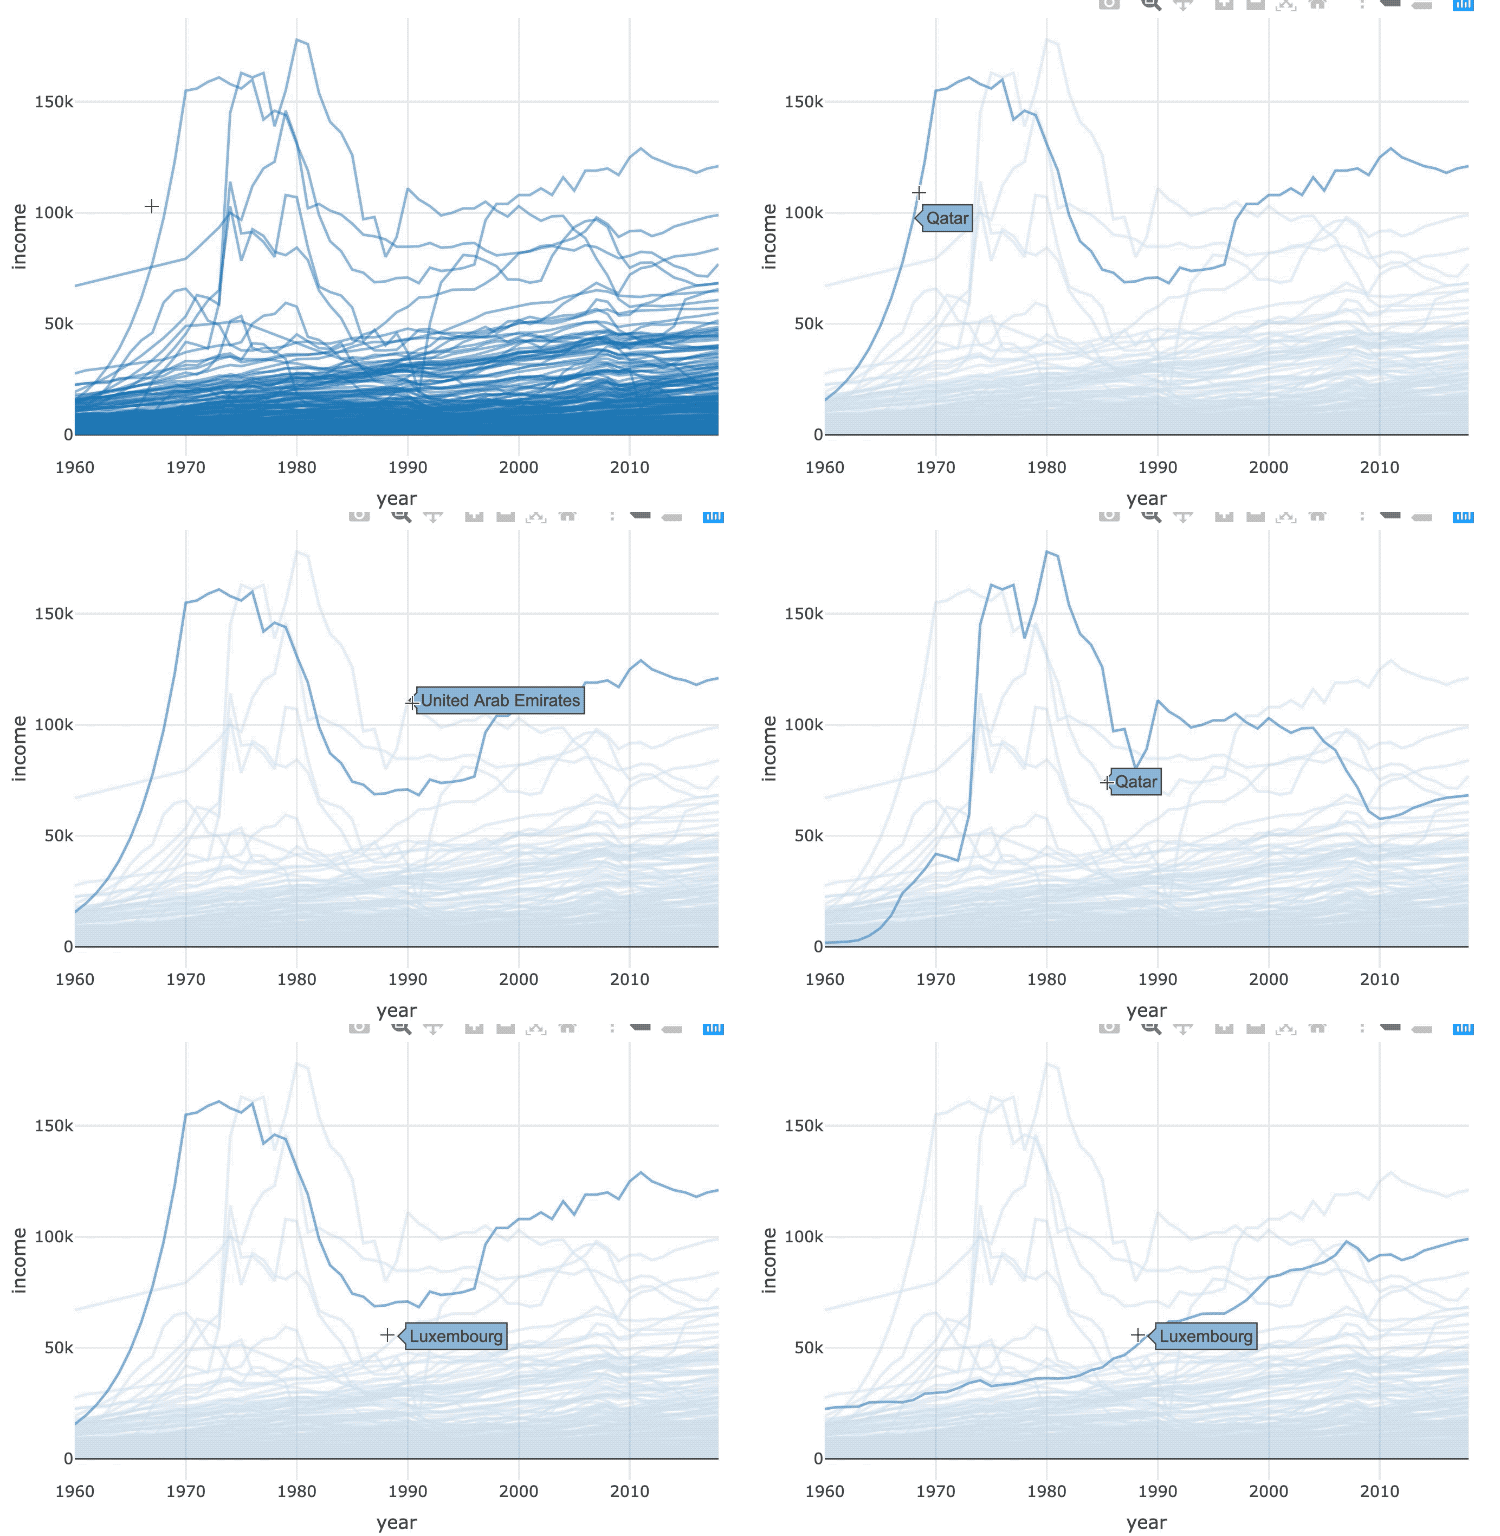
select_time_series.gif

การสร้างภาพข้อมูลเชิงโต้ตอบด้วย plotly ใน R ระดับกลาง

Indirect manipulation

world_indicators %>%
  SharedData$new(key = ~country) %>% 
  plot_ly(x = ~year, y = ~income, alpha = 0.5) %>%
  group_by(country) %>%
  add_lines()
การสร้างภาพข้อมูลเชิงโต้ตอบด้วย plotly ใน R ระดับกลาง

Indirect manipulation

world_indicators %>%
  SharedData$new(key = ~country, group = "Select a country") %>% 
  plot_ly(x = ~year, y = ~income, alpha = 0.5) %>%
  group_by(country) %>%
  add_lines() %>%
  highlight(selectize = TRUE)
การสร้างภาพข้อมูลเชิงโต้ตอบด้วย plotly ใน R ระดับกลาง

indirect_manipulation.gif

การสร้างภาพข้อมูลเชิงโต้ตอบด้วย plotly ใน R ระดับกลาง

มาฝึกกันเถอะ!

การสร้างภาพข้อมูลเชิงโต้ตอบด้วย plotly ใน R ระดับกลาง

Preparing Video For Download...