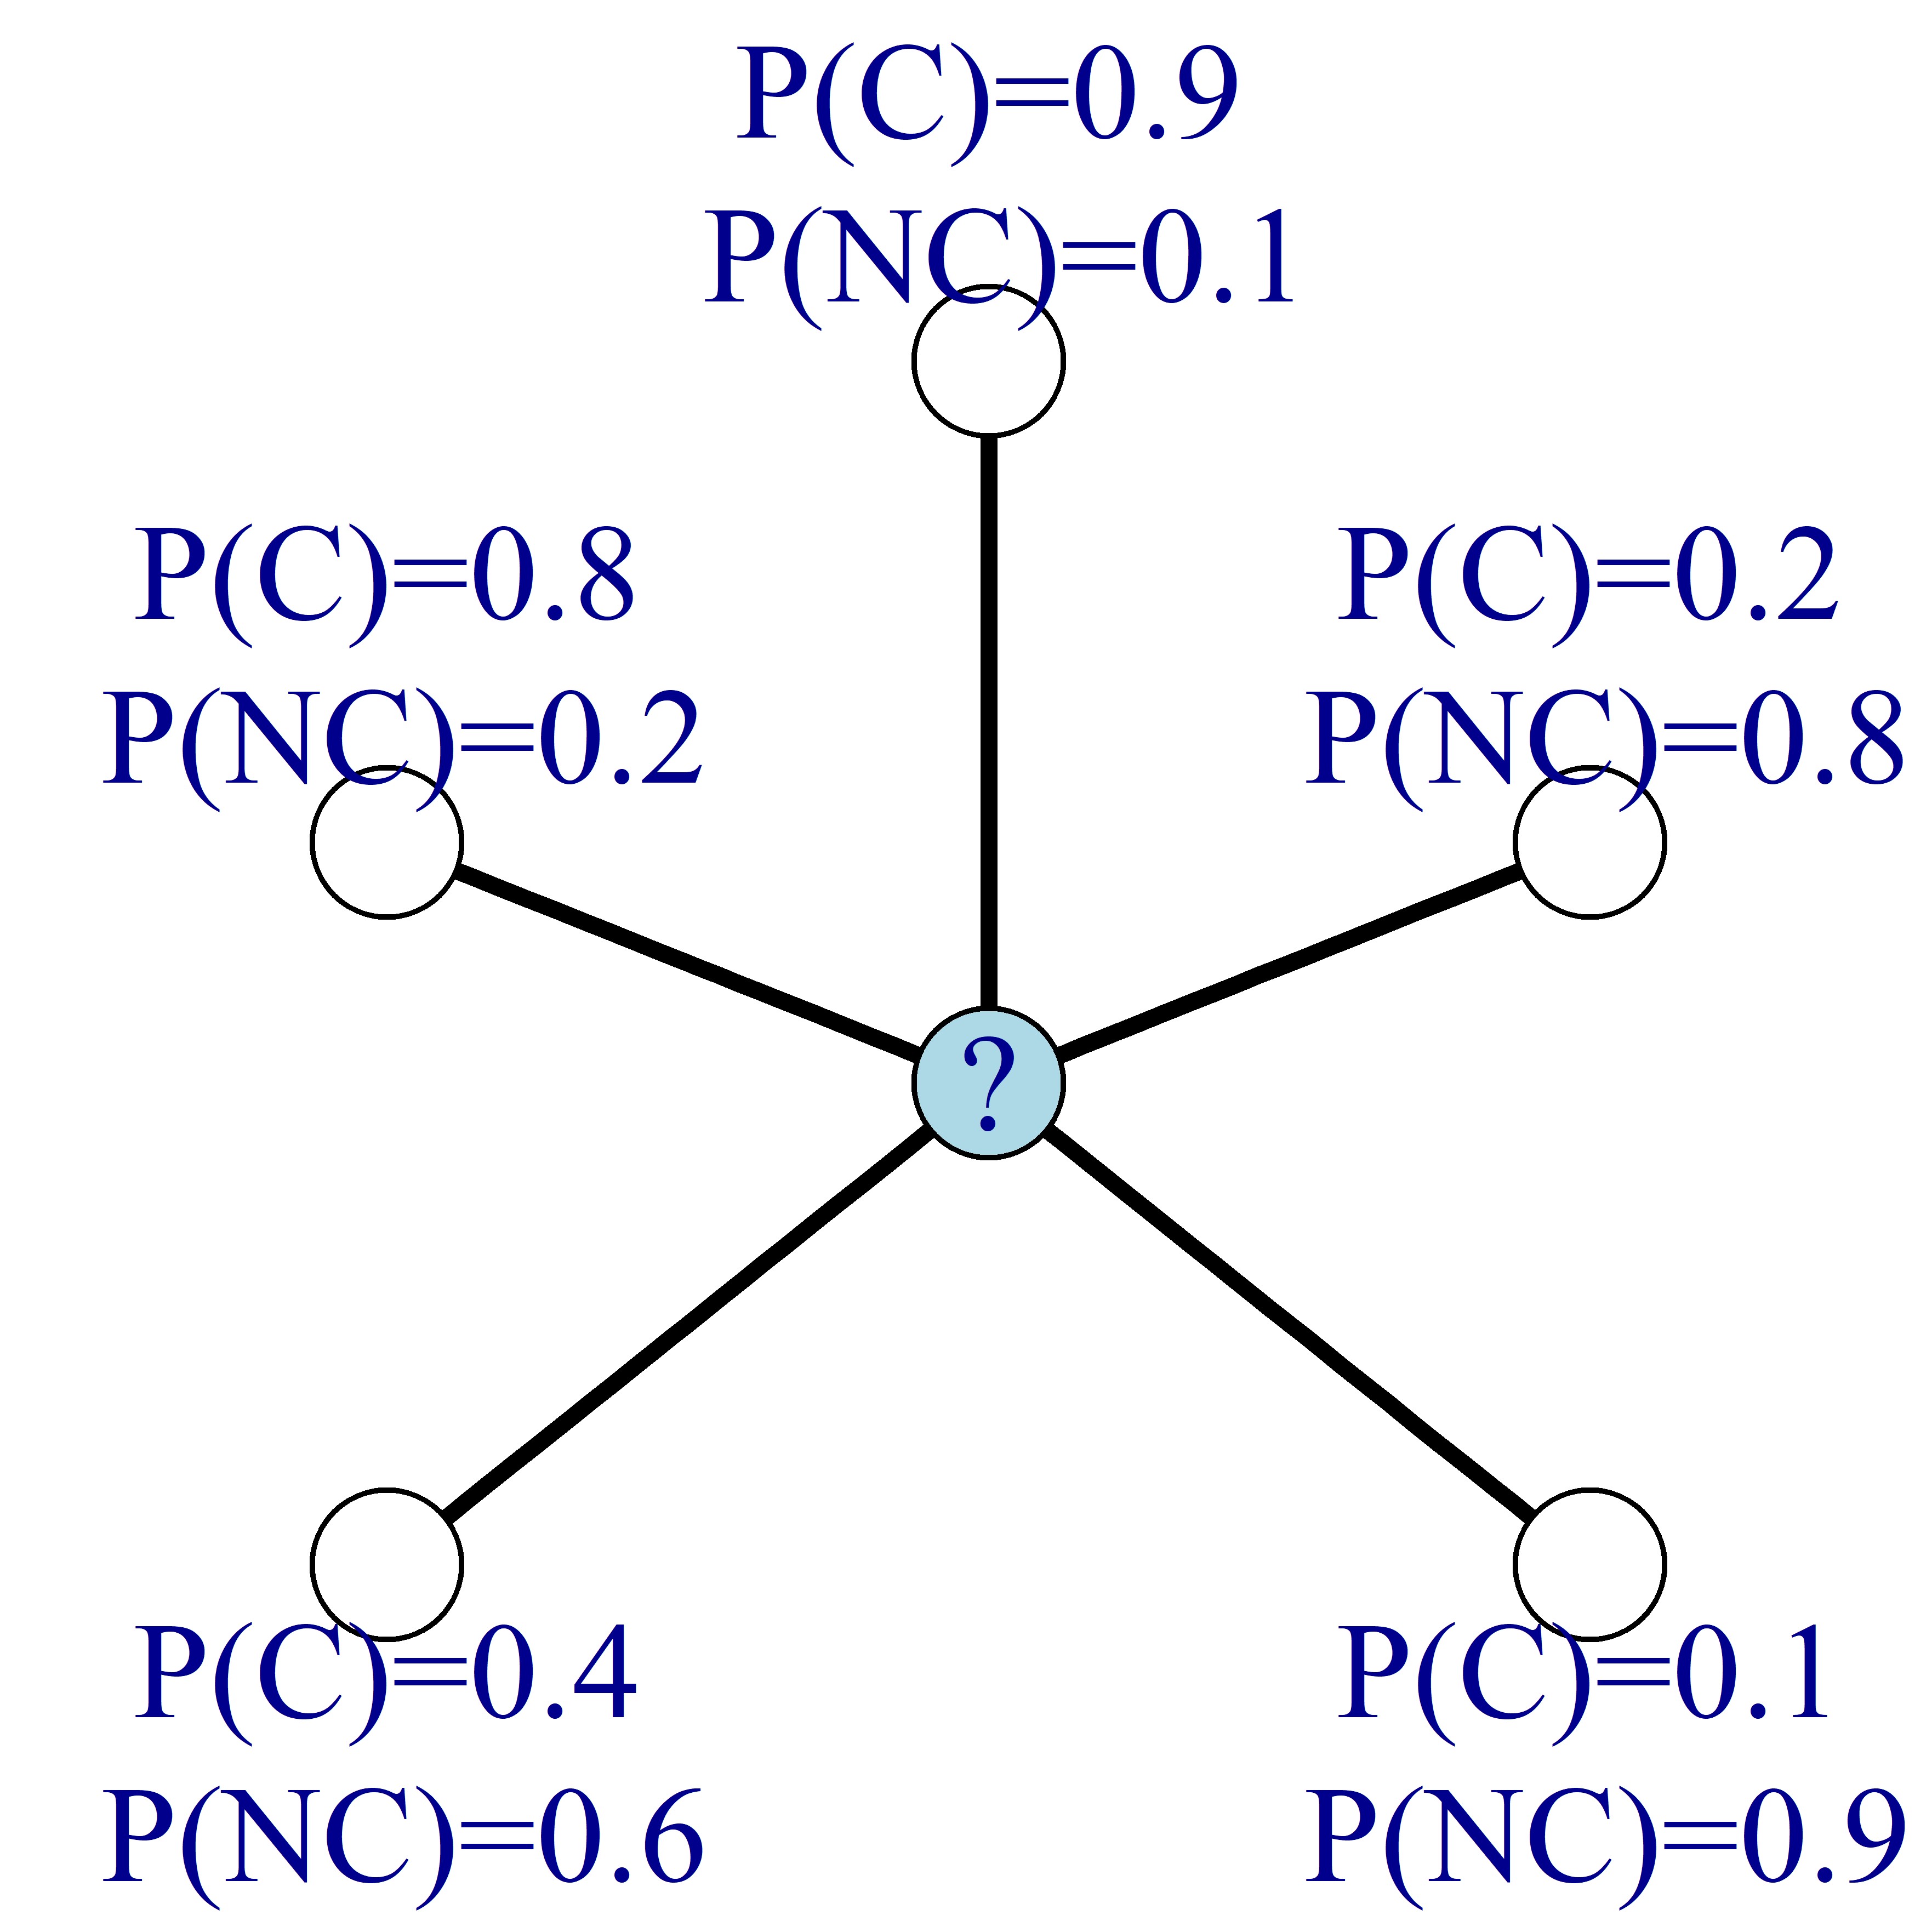
ความท้าทายของการอนุมานบนเครือข่าย
การวิเคราะห์เชิงพยากรณ์โดยใช้ข้อมูลเครือข่ายใน R

María Óskarsdóttir, Ph.D.
Post-doctoral researcher
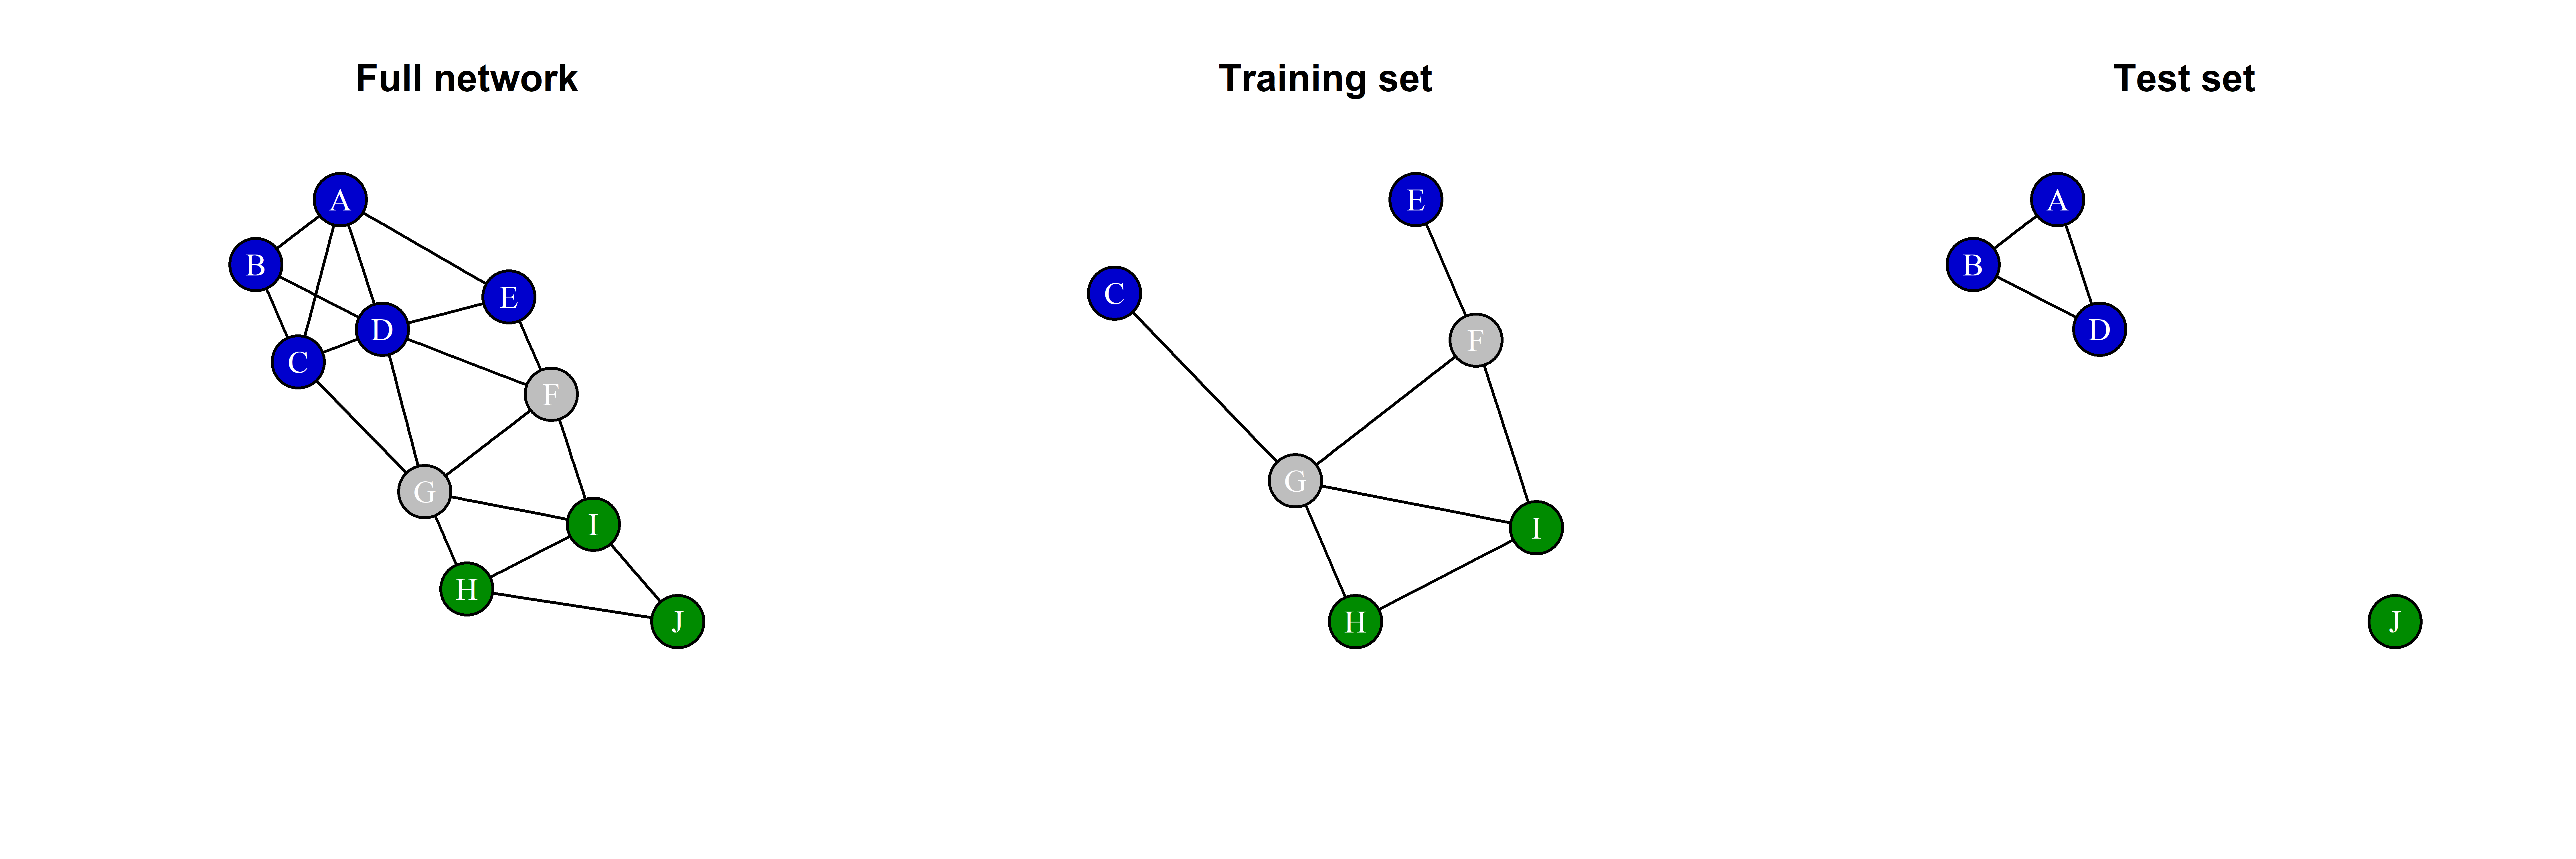
ความท้าทายที่หนึ่ง
การแบ่งข้อมูล!
set.seed(1001)
sampleVertices <- sample(1:10, 6, replace=FALSE)
plot(induced_subgraph(g, V(g)[sampleVertices]))
plot(induced_subgraph(g, V(g)[-sampleVertices]))
ความท้าทายที่สอง
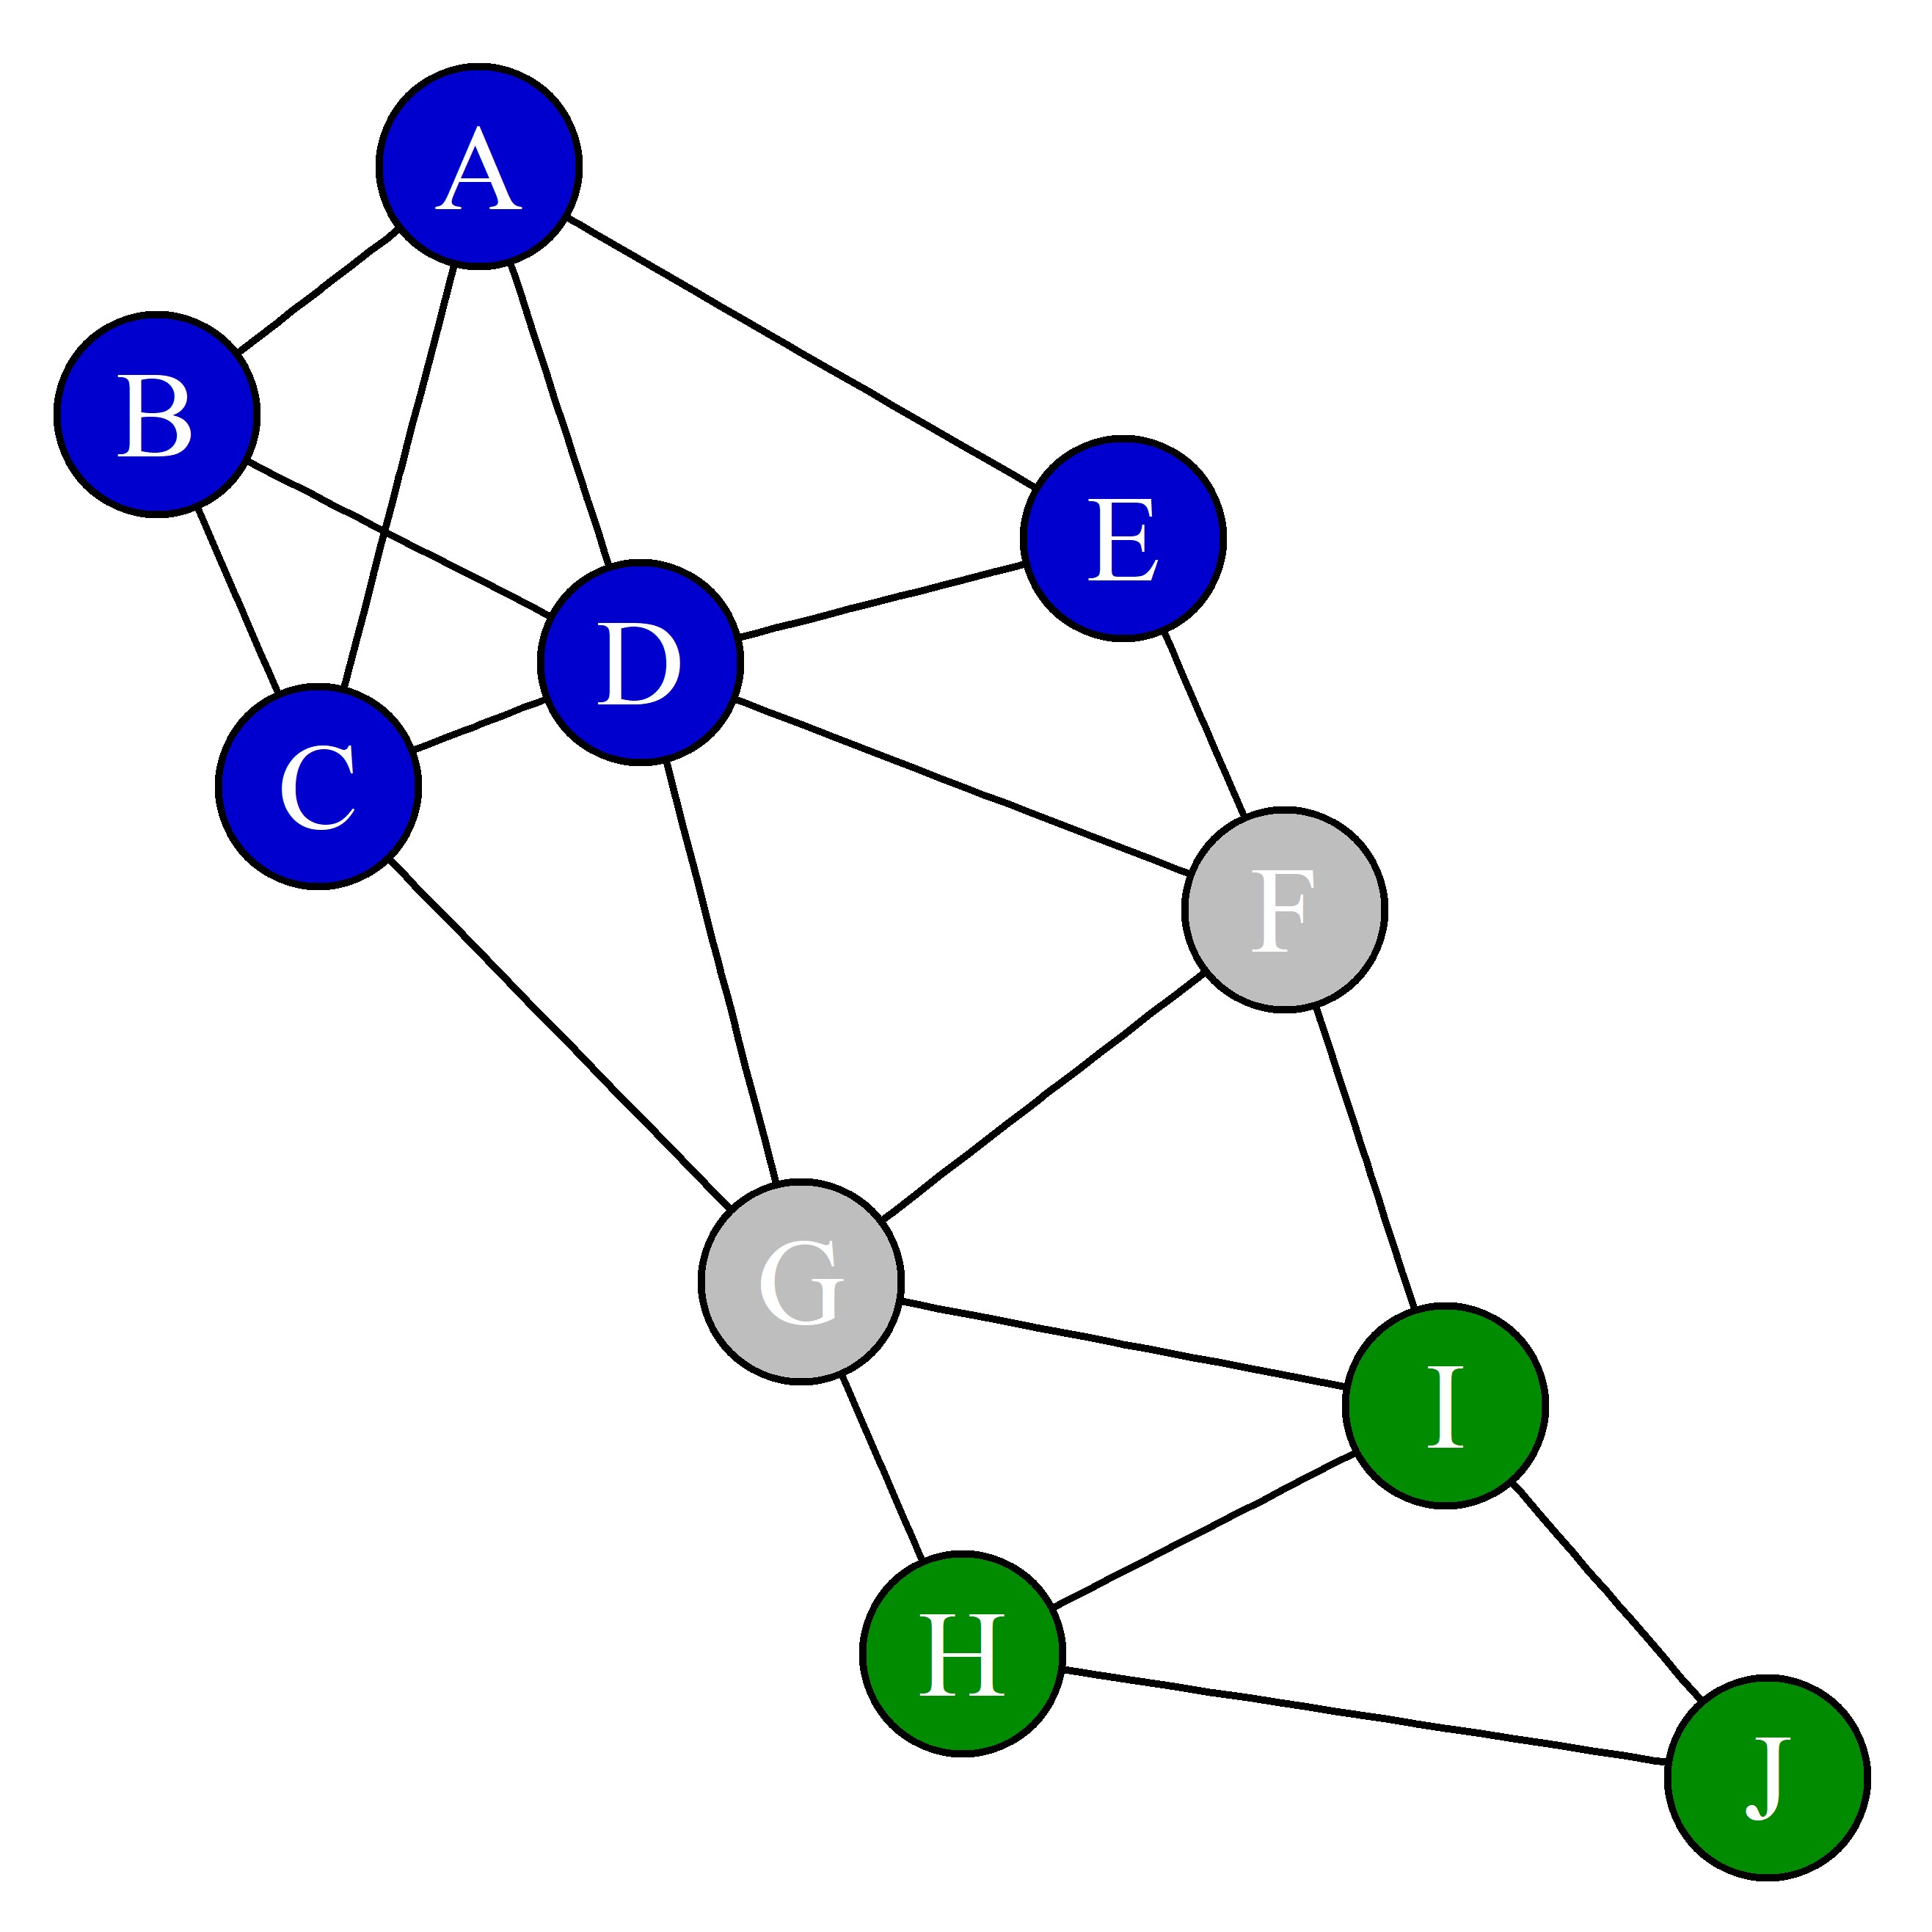
การสังเกตในชุดข้อมูลไม่ได้เป็นแบบอิสระและมีการแจกแจงเหมือนกัน (iid)
ความท้าทายที่สาม
การอนุมานแบบกลุ่ม!
ตัวแยกประเภทเพื่อนบ้านเชิงความน่าจะเป็นแบบสัมพันธ์