การปรับสเกลฟีเจอร์ที่ทนต่อ Outlier

การตรวจจับความผิดปกติใน Python

Bekhruz (Bex) Tuychiev

Kaggle Master, Data Science Content Creator

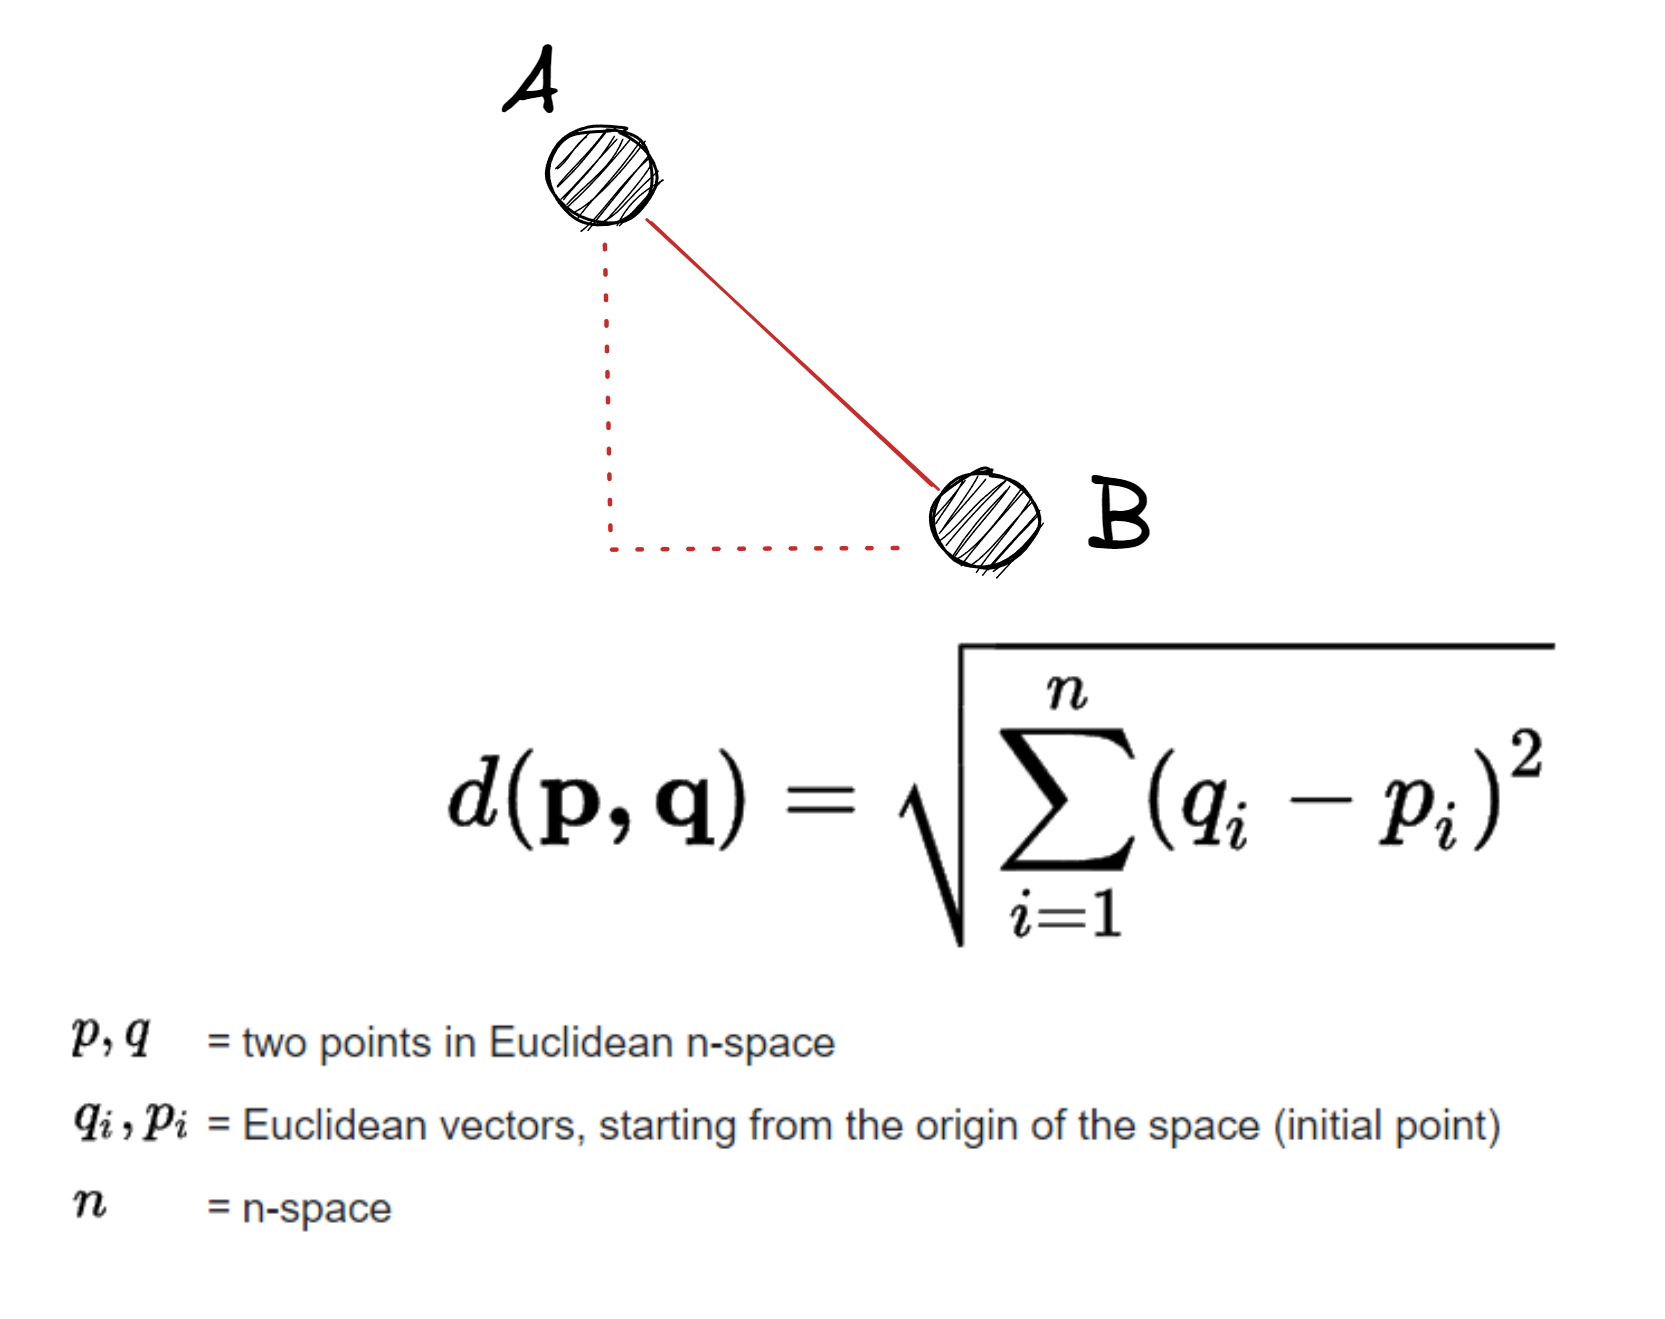
ระยะทางแบบยูคลิด
A = np.array([9, 1, 6])
B = np.array([25, 44, 85])


diffs = (B - A) ** 2
dist_AB = np.sqrt(np.sum(diffs)) print(dist_AB)
91.35644476444998

สูตรคำนวณระยะทางแบบยูคลิดและภาพประกอบ

การตรวจจับความผิดปกติใน Python

ระยะทางแบบยูคลิดใน SciPy

from scipy.spatial.distance import \
euclidean

dist_AB = euclidean(A, B)
dist_AB
91.35644476444998

สูตรคำนวณระยะทางแบบยูคลิดและภาพประกอบ

การตรวจจับความผิดปกติใน Python

การทำ Standardization

  • ลบค่าเฉลี่ยแล้วหารด้วยค่าเบี่ยงเบนมาตรฐาน
  • ผลลัพธ์: ค่าเฉลี่ยเป็น 0 และค่าเบี่ยงเบนมาตรฐานเป็น 1
การตรวจจับความผิดปกติใน Python

StandardScaler

from sklearn.preprocessing import StandardScaler

ss = StandardScaler()

# Extract feature and target X = males.drop("weightkg", axis=1) y = males[['weightkg']]
# Fit ss.fit(X)
การตรวจจับความผิดปกติใน Python

การแปลงข้อมูล

X_transformed = ss.transform(X)

X_transformed[:5]
array([[-1.05174523],
       [-0.29289108],
       [ 1.3446363 ],
       [-1.21654894],
       [0.056451235]])
การตรวจจับความผิดปกติใน Python

fit_transform

ss = StandardScaler()

X_transformed = ss.fit_transform(X)
การตรวจจับความผิดปกติใน Python

QuantileTransformer

from sklearn.preprocessing import QuantileTransformer


# Init qt = QuantileTransformer() X = males.drop("weightkg", axis=1) y = males[['weightkg']]
X_transformed = qt.fit_transform(X) X_transformed.shape
(4082, 94)
การตรวจจับความผิดปกติใน Python

การรักษาชื่อคอลัมน์

qt = QuantileTransformer()

X.loc[:, :] = qt.fit_transform(X)

X.head()

5 แถวแรกของชุดข้อมูล Ansur Males หลังการแปลงค่า

การตรวจจับความผิดปกติใน Python

ฮิสโตแกรมแบบสม่ำเสมอ

plt.hist(X['footlength'], color='red')

plt.xlabel("Foot length")
plt.title("Histogram of foot lengths")

plt.show()

ฮิสโตแกรมของคอลัมน์ความยาวเท้าที่แสดงการกระจายแบบสม่ำเสมอ

การตรวจจับความผิดปกติใน Python

ฮิสโตแกรมแบบโค้งปกติ

qt = QuantileTransformer(
  output_distribution='normal')

# Rebuild the overridden feature array
X = males.drop("weightkg", axis=1)
X.loc[:, :] = qt.fit_transform(X)

plt.hist(X['footlength'], color='r')
plt.xlabel("Foot length")
plt.title("Histogram of foot lengths")

plt.show()

ฮิสโตแกรมของคอลัมน์ความยาวเท้าที่แสดงการกระจายใกล้เคียงโค้งปกติ

การตรวจจับความผิดปกติใน Python

มาฝึกกันเถอะ!

การตรวจจับความผิดปกติใน Python

Preparing Video For Download...