Creating time series graphs with Matplotlib
Customer Analytics and A/B Testing in Python

Ryan Grossman
Data Scientist, EDO
Conversion rate over time
Useful Ways to Explore Metrics
- By user type
- Over time
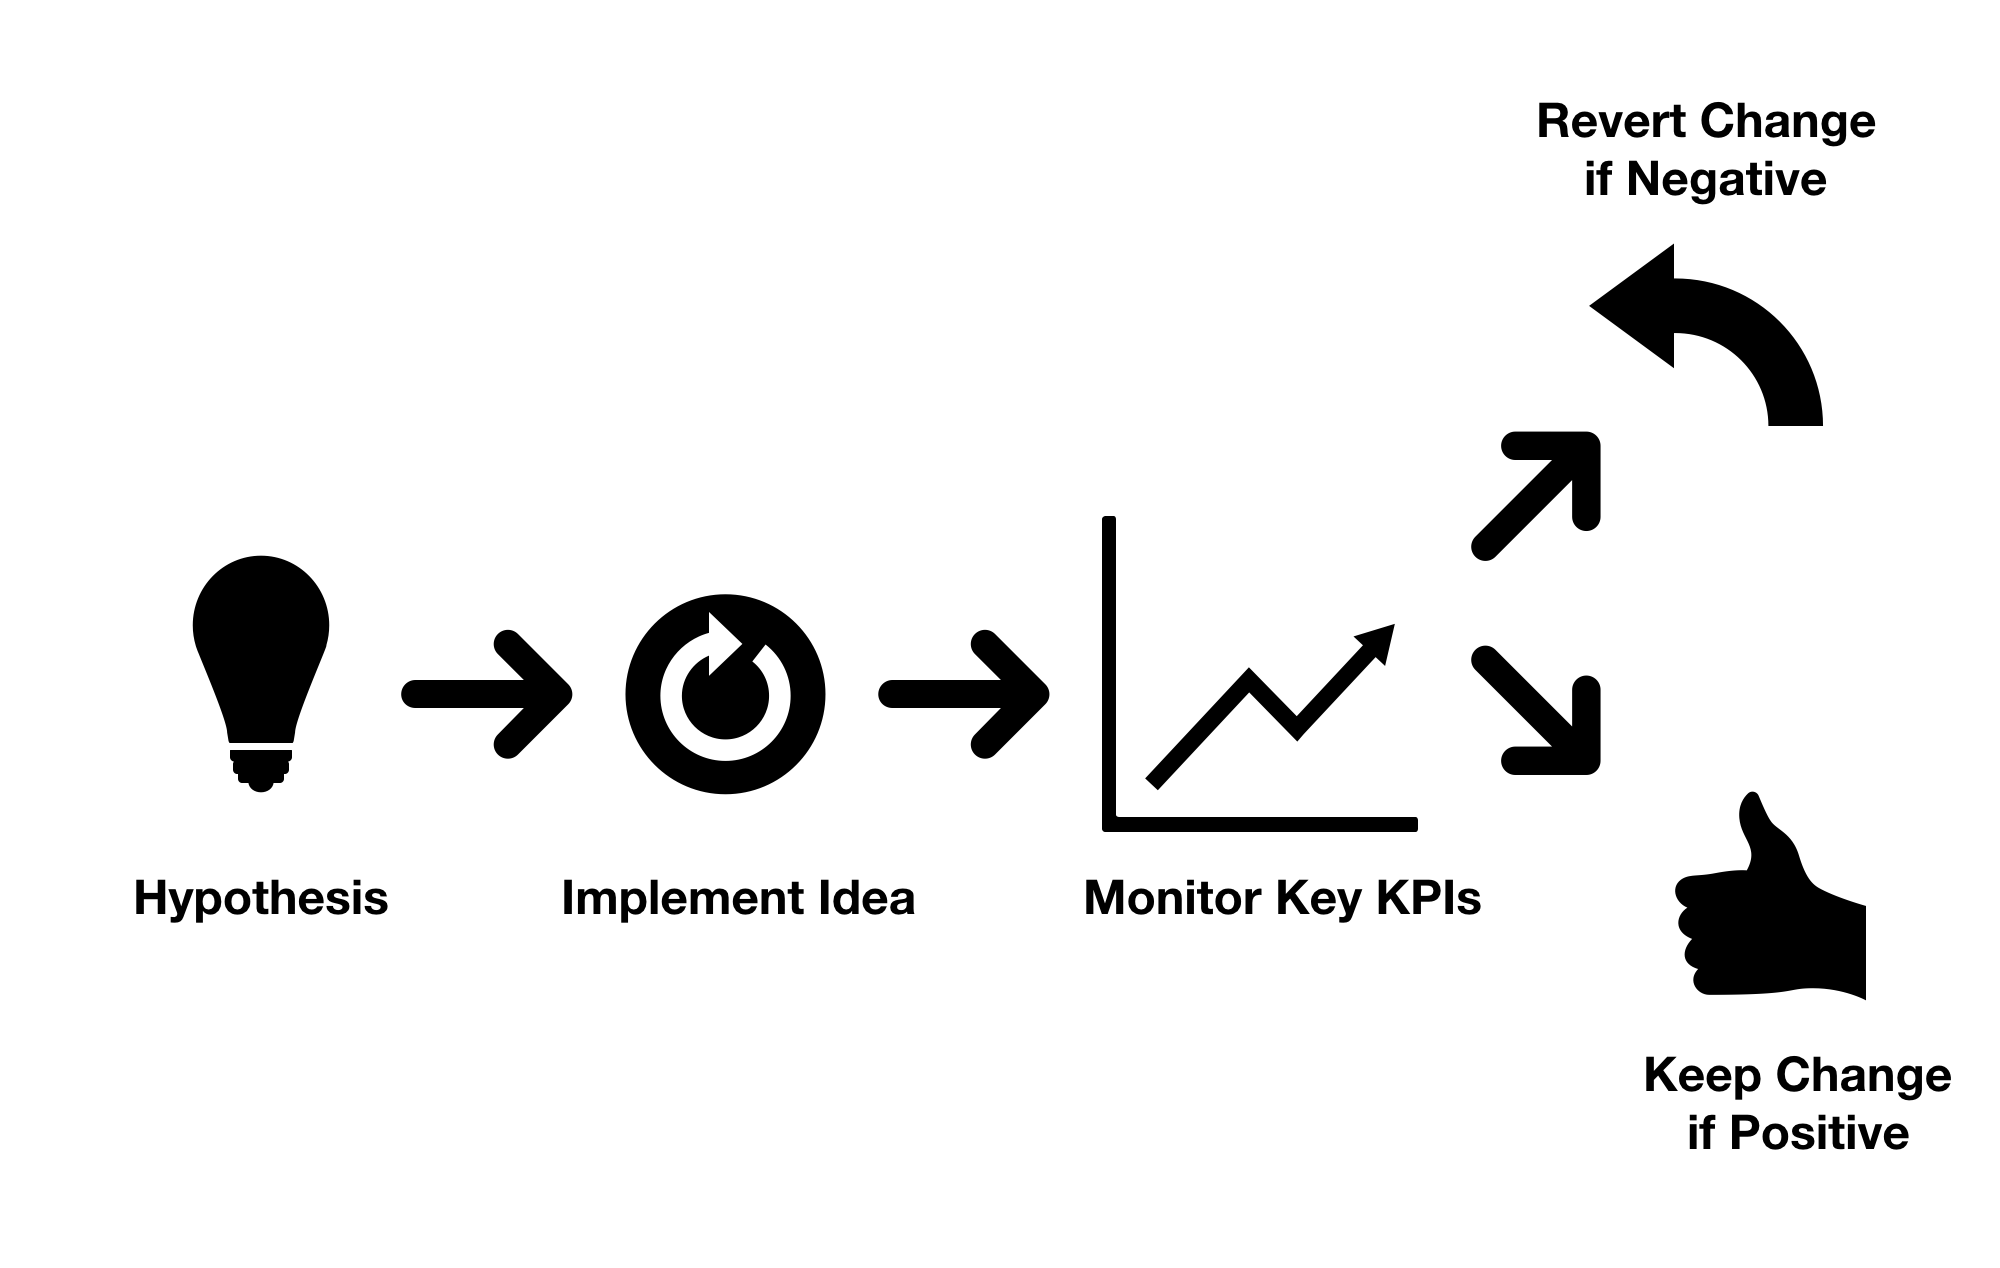
Monitoring the impact of changes

Week one conversion rate by day
import pandas as pd from datetime import timedelta # The maximum date in our dataset current_date = pd.to_datetime('2018-03-17')# Limit to users who have had a week to subscribe max_lapse_date = current_date - timedelta(days=7) conv_sub_data = sub_data_demo[ sub_data_demo.lapse_date < max_lapse_date]# Calculate how many days it took the user to subscribe conv_sub_data['sub_time'] = (conv_sub_data.subscription_date - conv_sub_data.lapse_date.dt.days)
Conversion Rate by Day
- First day to register,
reg_date, equals the free triallapse_date - These terms are used interchangeably throughout
# Find the convsersion rate for each daily cohort conversion_data = conv_sub_data.groupby( by=['lapse_date'],as_index=False).agg({'sub_time': [gc7]})# Clean up the dataframe columns conversion_data.head()
    lapse_date    sub_time
0    2017-09-01    0.224775
1    2017-09-02    0.223749
...
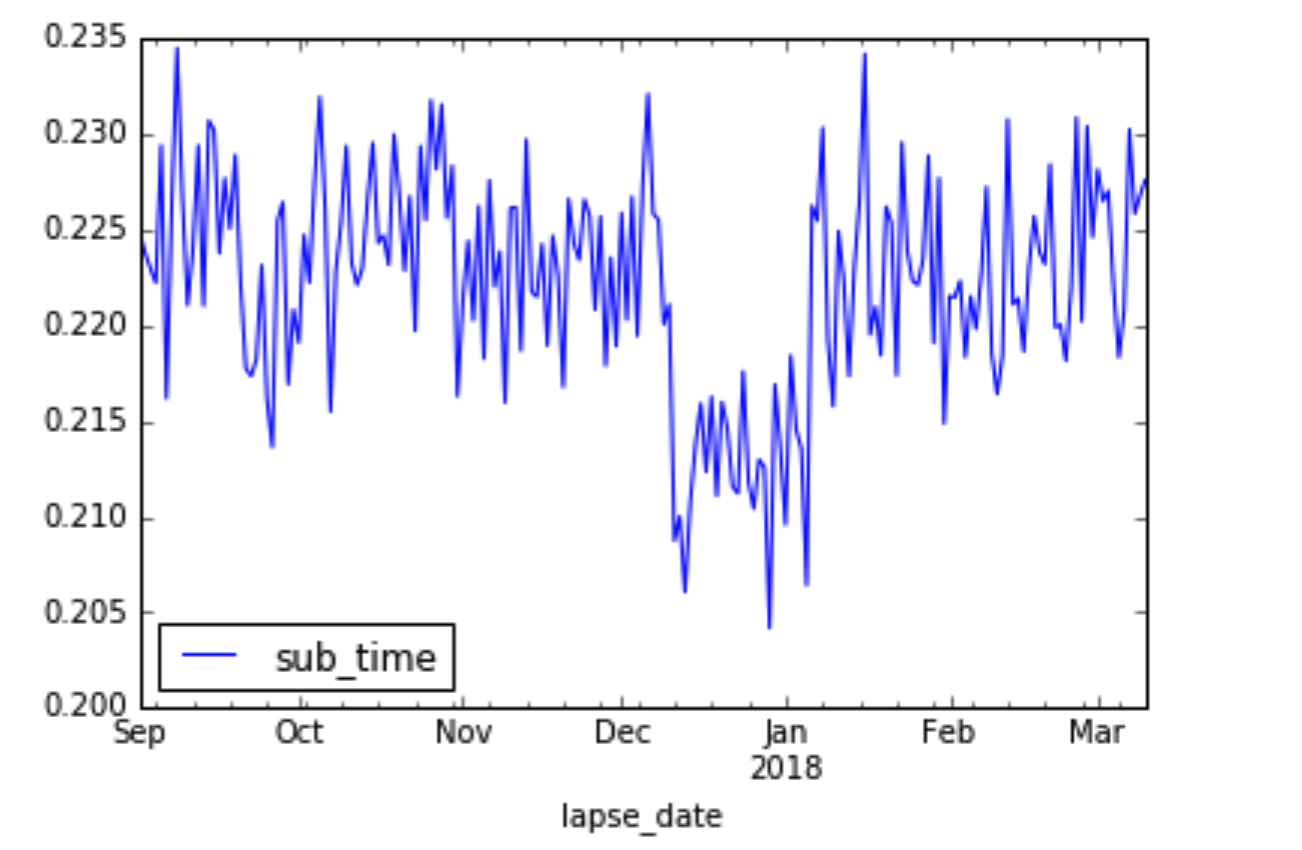
Plotting Daily Conversion Rate
- Use the
.plot()method to generate graphs of DataFrames
# Convert the lapse_date value from a string to a datetime value conversion_data["lapse_date"] = pd.to_datetime( conversion_data.lapse_date )# Plot a line graph of the average conversion rate for each user registration cohort conversion_data.plot(x='lapse_date', y='sub_time')
Plotting Daily Conversion Rate
# Print the generated graph to the screen
plt.show()

Trends in different cohorts
- See how changes interact with different groups
- Compare users of different genders
- Evaluate the impact of a change across regions
- See the impact for different devices
Trends across time and user groups
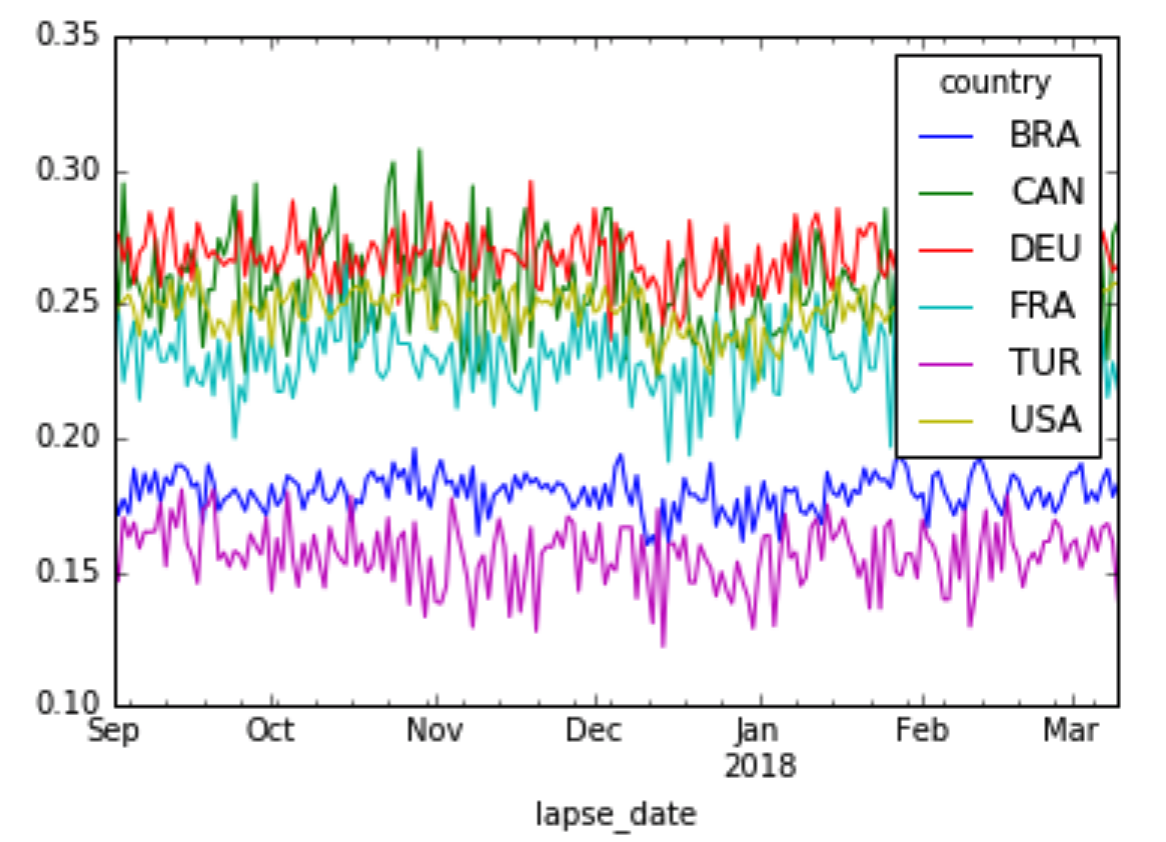
- Is the holiday dip consistent across different countries?
conversion_data.head()
- Conversion rate by day, broken out by our top selling countries
    lapse_date    country    sub_time
0    2017-09-01    BRA        0.184000
1    2017-09-01    CAN        0.285714
2    2017-09-01    DEU        0.276119
3    2017-09-01    FRA        0.240506
4    2017-09-01    TUR        0.161905
Conversion rate by country
# Break out our conversion rate by country reformatted_cntry_data = pd.pivot_table( conversion_data, # DataFrame to reshapevalues=['sub_time'], # Our primary valuecolumns=['country'], # what to break out byindex=['lapse_date'], # "earliest sub date for cohort" fill_value=0 )
lapse_date        BRA         CAN        DEU
2017-09-01        0.184000    0.285714    0.276119    ...
2017-09-02        0.171296    0.244444    0.276190    ...
2017-09-03        0.177305    0.295082    0.266055    ...
Plotting trends in different cohorts
# Plot each countries conversion rate reformatted_cntry_data.plot(x='lapse_date',y=['BRA','FRA','DEU','TUR','USA','CAN'] )
plt.show()

Let's practice!
Customer Analytics and A/B Testing in Python

